PROTECTED SOURCE SCRIPT
Actualizado Squeeze Zone
This script supports my previous post Empirical Suite
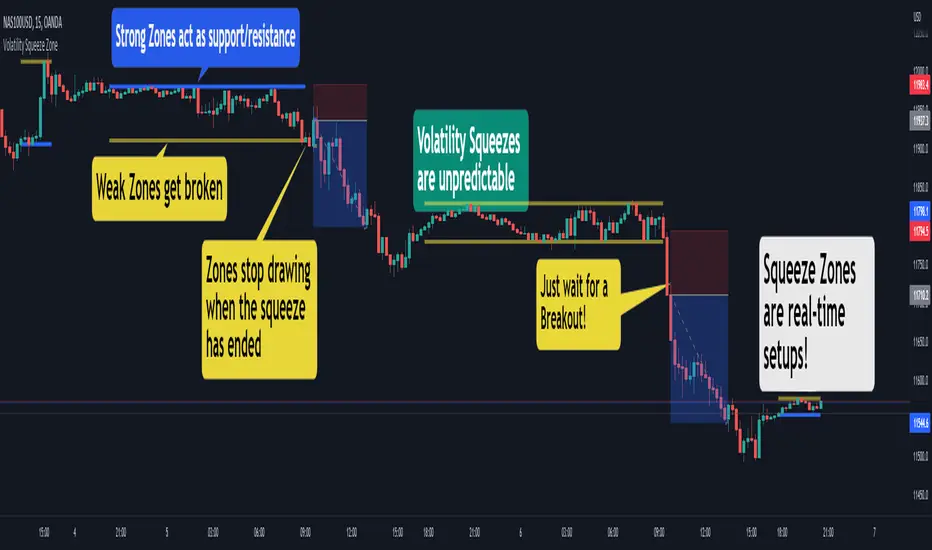
It automatically plots Support and Resistance levels on the chart during periods of volatility squeeze.
You have three plotting methods:
The levels are color-coded:
*Red: weak, one-sided volatility squeeze
*Orange: typically strong, no volatility issue
You can have a double-red zone, where both buying and selling volatility has dropped.
Combine this with the Empirical Suite or your favorite
analysis tools for extra confirmation.
Cheers,
EFX
It automatically plots Support and Resistance levels on the chart during periods of volatility squeeze.
You have three plotting methods:
- From High to Low
- From Open to Close
- Linear Regression (experimental)
The levels are color-coded:
*Red: weak, one-sided volatility squeeze
*Orange: typically strong, no volatility issue
You can have a double-red zone, where both buying and selling volatility has dropped.
Combine this with the Empirical Suite or your favorite
analysis tools for extra confirmation.
Cheers,
EFX
Notas de prensa
Updated defaultsRemoved poorly performing settings
Notas de prensa
- Upgrade to Pine V5
- Choose your own colors for Zones!
- Improved default settings
Script protegido
Este script se publica como código cerrado. No obstante, puede utilizarlo libremente y sin ninguna limitación. Obtenga más información aquí.
Algo Trading Simplified 👉 PaxProfits.com
Discover the easy way to manage Forex trading accounts. Trusted by traders globally.
Discover the easy way to manage Forex trading accounts. Trusted by traders globally.
Exención de responsabilidad
La información y las publicaciones no constituyen, ni deben considerarse como asesoramiento o recomendaciones financieras, de inversión, de trading o de otro tipo proporcionadas o respaldadas por TradingView. Más información en Condiciones de uso.