OPEN-SOURCE SCRIPT
Actualizado Supply and Demand Zones
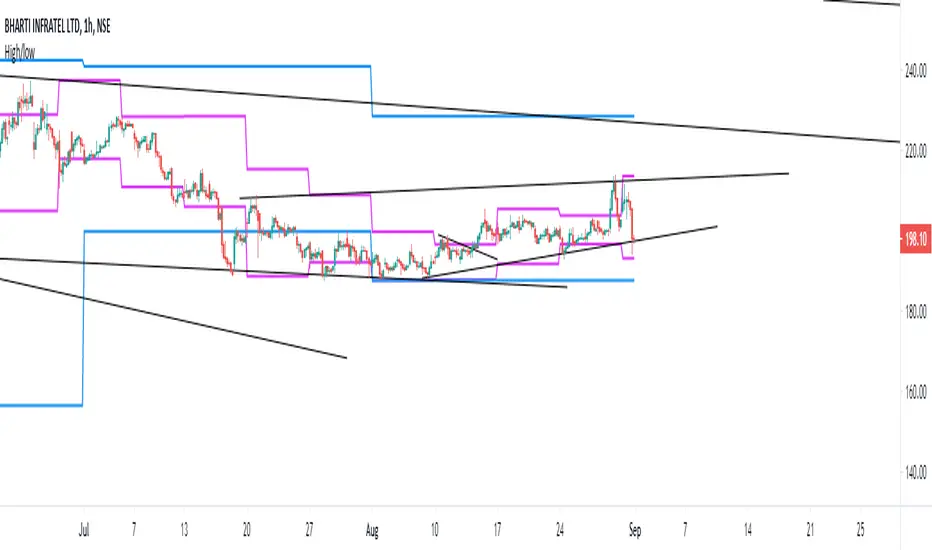
This indicators should be used along with price action breakout
Red zones - Red zones are formed daily
10 days average ranges
Blue zones - Blue zones are formed every week
10 weeks average ranges
Green zones - Green zones are formed every month
10 months averange ranges
Red zones - Red zones are formed daily
10 days average ranges
Blue zones - Blue zones are formed every week
10 weeks average ranges
Green zones - Green zones are formed every month
10 months averange ranges
Notas de prensa
It will just plot the close priceNotas de prensa
It will plot the previous day's high and lowNotas de prensa
Now it will plot previous day , previous week and previous month high and lowScript de código abierto
Fiel al espíritu de TradingView, el creador de este script lo ha convertido en código abierto, para que los traders puedan revisar y verificar su funcionalidad. ¡Enhorabuena al autor! Aunque puede utilizarlo de forma gratuita, recuerde que la republicación del código está sujeta a nuestras Normas internas.
Exención de responsabilidad
La información y las publicaciones no constituyen, ni deben considerarse como asesoramiento o recomendaciones financieras, de inversión, de trading o de otro tipo proporcionadas o respaldadas por TradingView. Más información en Condiciones de uso.
Script de código abierto
Fiel al espíritu de TradingView, el creador de este script lo ha convertido en código abierto, para que los traders puedan revisar y verificar su funcionalidad. ¡Enhorabuena al autor! Aunque puede utilizarlo de forma gratuita, recuerde que la republicación del código está sujeta a nuestras Normas internas.
Exención de responsabilidad
La información y las publicaciones no constituyen, ni deben considerarse como asesoramiento o recomendaciones financieras, de inversión, de trading o de otro tipo proporcionadas o respaldadas por TradingView. Más información en Condiciones de uso.