OPEN-SOURCE SCRIPT
RahulLines Cloud
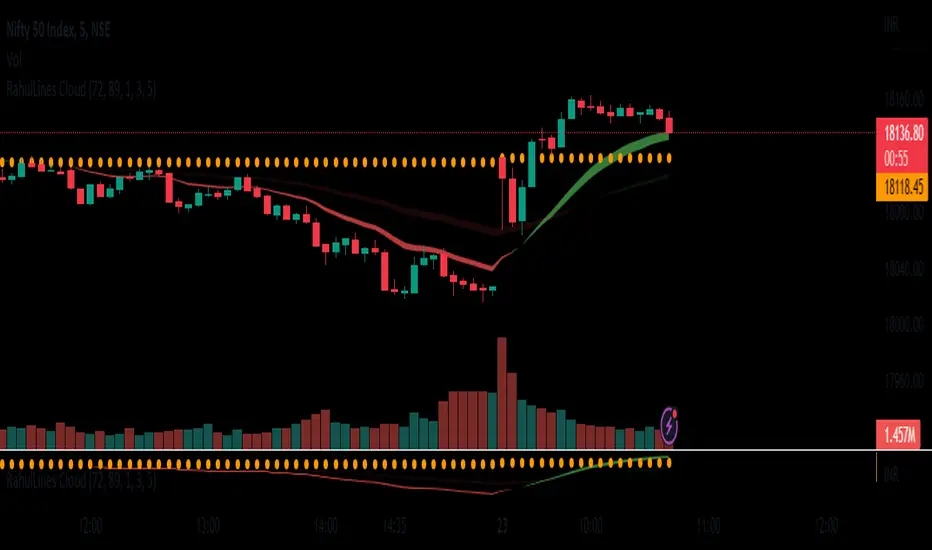
J-Lines Cloud is a technical analysis tool that is used to identify potential support and resistance levels on a chart. It is based on the concept of the "J-Lines," which are lines that are drawn on a chart in order to identify potential turning points in price. The J-Lines Cloud is a variation of the J-Lines that is used to identify levels of support and resistance using cloud, it typically uses multiple lines to create a cloud-like shape, which represents a zone of support or resistance.
To use the J-Lines Cloud, you will typically need a charting platform that has the ability to plot the J-Lines Cloud indicator. The indicator will typically take the form of a cloud-like shape on the chart, with different colors used to represent different levels of support and resistance.
Once the J-Lines Cloud is plotted on the chart, traders can use it to identify potential levels at which the price of an asset may change direction. For example, if the price of an asset is approaching a level of resistance identified by the J-Lines Cloud, a trader may choose to sell or exit a long position. Conversely, if the price of an asset is approaching a level of support identified by the J-Lines Cloud, a trader may choose to buy or enter a long position.
It's important to note that the J-Lines Cloud is a tool for technical analysis and not a standalone strategy, it should be used in combination with other indicators or strategies and also it should be used with the proper risk management and stop loss analysis.
Script de código abierto
Fiel al espíritu de TradingView, el creador de este script lo ha convertido en código abierto, para que los traders puedan revisar y verificar su funcionalidad. ¡Enhorabuena al autor! Aunque puede utilizarlo de forma gratuita, recuerde que la republicación del código está sujeta a nuestras Normas internas.
Exención de responsabilidad
La información y las publicaciones no constituyen, ni deben considerarse como asesoramiento o recomendaciones financieras, de inversión, de trading o de otro tipo proporcionadas o respaldadas por TradingView. Más información en Condiciones de uso.