OPEN-SOURCE SCRIPT
Actualizado Heatmapped Bollinger Bands
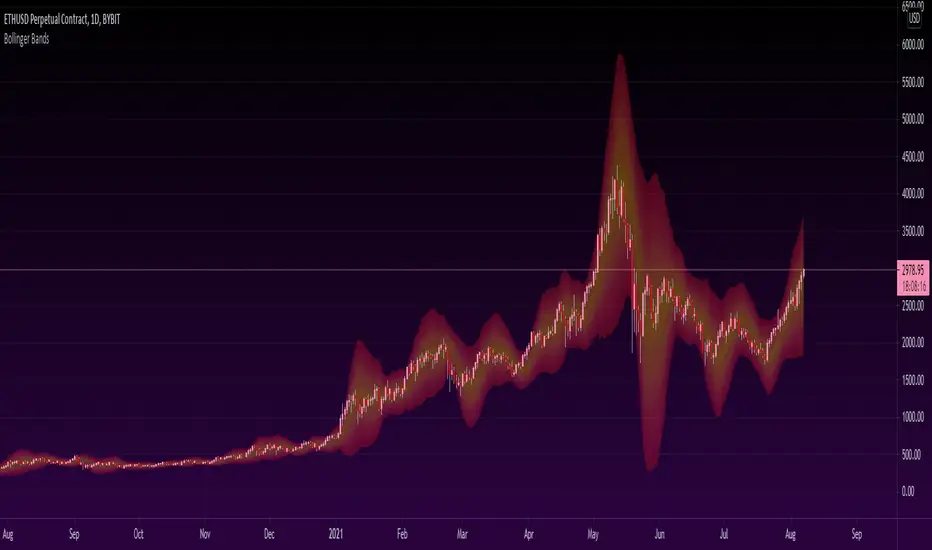
Bollinger Bands have been used for many years to determine the volatility and potential reversal area of markets. This script takes standard Bollinger Bands (BB) and transforms it into a heatmap of reversal areas.
A basic explanation on how this indicator works is:
- Yellow is where the price likes to stay,
- Orange is where the price might begin to reverse in a weak trend, and
- Red is where the price will either pause to let the yellow range catch up, or where the price will jump back down into the yellow range to stabilize.
For educational purposes: this script is essentially just taking the standard method of creating Bollinger Bands (seen in the 'Main Lines' portion of the script), coloring the plots 'na' so that they aren't seen, and using the 'fill' function to plot the yellow to red rainbow up to the top. I believe I made the yellow range 0.2*stdev to 1*stdev, the orange range 1*stdev to 2*stdev, and the red range 2*stdev to 3*stdev. You can get the hex code rainbow from any website that has a color slider.
** Disclaimer: THIS IS NOT TRADING ADVICE. Bollinger Bands should be used in conjunction with other indicators to make better decisions but NO STRATEGY IS PERFECT. Always backtest any strategy before using it live. **
Notas de prensa
Incorrect copyright username in script after username change. Corrected to @OztheWoz.Script de código abierto
Fiel al espíritu de TradingView, el creador de este script lo ha convertido en código abierto, para que los traders puedan revisar y verificar su funcionalidad. ¡Enhorabuena al autor! Aunque puede utilizarlo de forma gratuita, recuerde que la republicación del código está sujeta a nuestras Normas internas.
Exención de responsabilidad
La información y las publicaciones no constituyen, ni deben considerarse como asesoramiento o recomendaciones financieras, de inversión, de trading o de otro tipo proporcionadas o respaldadas por TradingView. Más información en Condiciones de uso.
Script de código abierto
Fiel al espíritu de TradingView, el creador de este script lo ha convertido en código abierto, para que los traders puedan revisar y verificar su funcionalidad. ¡Enhorabuena al autor! Aunque puede utilizarlo de forma gratuita, recuerde que la republicación del código está sujeta a nuestras Normas internas.
Exención de responsabilidad
La información y las publicaciones no constituyen, ni deben considerarse como asesoramiento o recomendaciones financieras, de inversión, de trading o de otro tipo proporcionadas o respaldadas por TradingView. Más información en Condiciones de uso.