PROTECTED SOURCE SCRIPT
(EMI 1) Epic Market Indicator v2.2
Had to release a new version, due to house rules.
This indicator is usable for every market and I do suggest to use it in combination with EMI 2.
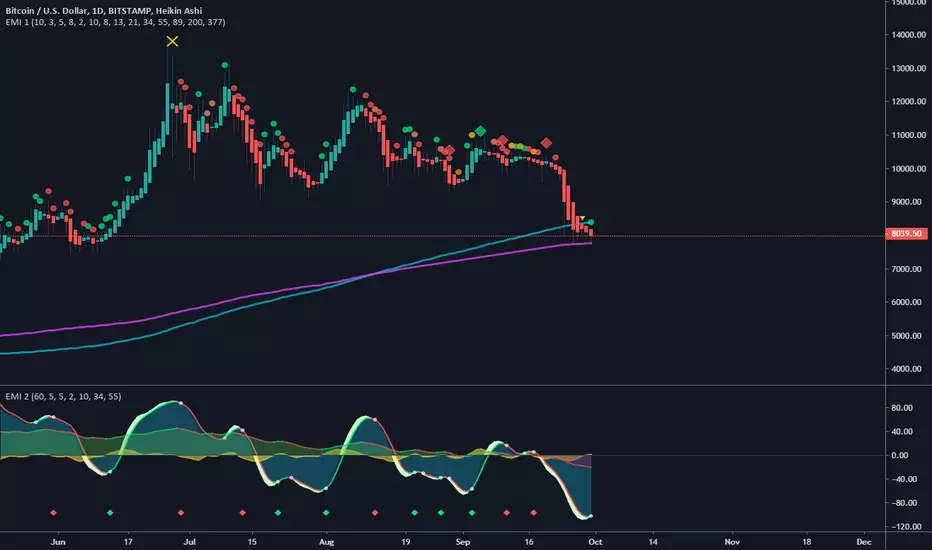
Green = buy/long, Red = sell/short
Orange = Price action divergence/convergence.
Yellow X = Manipulation, you might to be careful when you see this, most of the time dumps happens afterwards.
Always wait for the candle/bar to close and if possible wait for another confirmation. No confirmation most of the time means, trend continuation.
Diamonds are the strongest signal, you might want to to buy/long or sell/short when you see this signals.
Cirles/Dots are trend continuation, shows which way the trend. More of the same color in a row the stronger the prediction. But once you see an orange colored signal then it's possibly going to diverge.
Longer the term/period the more accurate prediction signals will be.
You can enable/disable other tools in the settings:
EMA's, SMA , Bollinger Bands and Pivots .
But also trend colors
Setup your own configurations the way you like. I recommend using Fibonacci seq . Keep in mind, sooner the prediction signals become the more riskier.
update:
- Added bollinger bands with trend color. You can disable or enable this in the settings.
- Modified manipulation conditions.
- Modified buy and sell conditions.
This indicator is usable for every market and I do suggest to use it in combination with EMI 2.
Green = buy/long, Red = sell/short
Orange = Price action divergence/convergence.
Yellow X = Manipulation, you might to be careful when you see this, most of the time dumps happens afterwards.
Always wait for the candle/bar to close and if possible wait for another confirmation. No confirmation most of the time means, trend continuation.
Diamonds are the strongest signal, you might want to to buy/long or sell/short when you see this signals.
Cirles/Dots are trend continuation, shows which way the trend. More of the same color in a row the stronger the prediction. But once you see an orange colored signal then it's possibly going to diverge.
Longer the term/period the more accurate prediction signals will be.
You can enable/disable other tools in the settings:
EMA's, SMA , Bollinger Bands and Pivots .
But also trend colors
Setup your own configurations the way you like. I recommend using Fibonacci seq . Keep in mind, sooner the prediction signals become the more riskier.
update:
- Added bollinger bands with trend color. You can disable or enable this in the settings.
- Modified manipulation conditions.
- Modified buy and sell conditions.
Script protegido
Este script se publica como código cerrado. No obstante, puede utilizarlo libremente y sin ninguna limitación. Obtenga más información aquí.
Exención de responsabilidad
La información y las publicaciones no constituyen, ni deben considerarse como asesoramiento o recomendaciones financieras, de inversión, de trading o de otro tipo proporcionadas o respaldadas por TradingView. Más información en Condiciones de uso.