OPEN-SOURCE SCRIPT
Actualizado Key Levels
Key Levels Indicator
In the world of trading, manually identifying and plotting key levels for every close can be a tedious and error-prone task. This indicator stands out by automatically detecting and plotting only those levels where a significant shift in market sentiment has occurred. Unlike traditional indicators that plot lines for every open or close, this tool focuses on levels where liquidity has changed hands, indicating a potential shift in momentum.
How It Works:
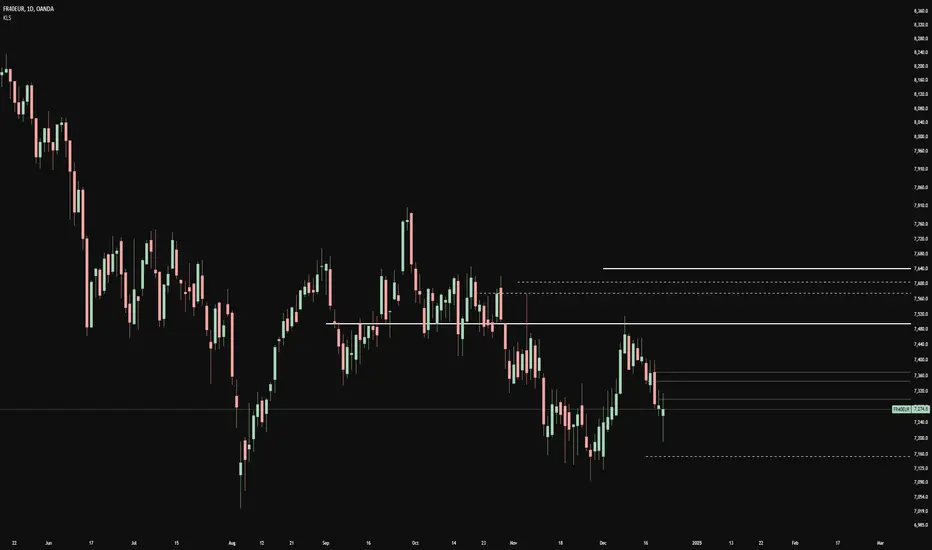
- The indicator identifies Higher Timeframe (HTF) reversals, plotting levels only when a bearish candle is followed by a bullish one, or vice versa.
- Weekly levels are represented by dashed lines, while monthly levels are solid, providing clear visual differentiation.
- Levels are drawn at the open price of the reversal candle, starting precisely at the beginning of the new HTF bar.
Why It's Different:
- Focuses on genuine shifts in market sentiment rather than arbitrary price points.
- Automatically manages the number of visible levels to prevent chart clutter.
- Ideal for range traders and mean reversion strategies, offering insights into potential support and resistance zones where market participants have shown a change in behavior.
Usage Note:
While this indicator provides valuable insights, it should not be used in isolation. Always consider the broader market context and combine it with other analysis techniques for optimal results.
Settings:
- Toggle weekly/monthly levels
- Adjust the number of visible levels (1-20)
- Customize level colors
In the world of trading, manually identifying and plotting key levels for every close can be a tedious and error-prone task. This indicator stands out by automatically detecting and plotting only those levels where a significant shift in market sentiment has occurred. Unlike traditional indicators that plot lines for every open or close, this tool focuses on levels where liquidity has changed hands, indicating a potential shift in momentum.
How It Works:
- The indicator identifies Higher Timeframe (HTF) reversals, plotting levels only when a bearish candle is followed by a bullish one, or vice versa.
- Weekly levels are represented by dashed lines, while monthly levels are solid, providing clear visual differentiation.
- Levels are drawn at the open price of the reversal candle, starting precisely at the beginning of the new HTF bar.
Why It's Different:
- Focuses on genuine shifts in market sentiment rather than arbitrary price points.
- Automatically manages the number of visible levels to prevent chart clutter.
- Ideal for range traders and mean reversion strategies, offering insights into potential support and resistance zones where market participants have shown a change in behavior.
Usage Note:
While this indicator provides valuable insights, it should not be used in isolation. Always consider the broader market context and combine it with other analysis techniques for optimal results.
Settings:
- Toggle weekly/monthly levels
- Adjust the number of visible levels (1-20)
- Customize level colors
Notas de prensa
Key Levels IndicatorIn the world of trading, manually identifying and plotting key levels for every close can be a tedious and error-prone task. This indicator stands out by automatically detecting and plotting only those levels where a significant shift in market sentiment has occurred. Unlike traditional indicators that plot lines for every open or close, this tool focuses on levels where liquidity has changed hands, indicating a potential shift in momentum.
How It Works:
- The indicator identifies Higher Timeframe (HTF) reversals, plotting levels only when a bearish candle is followed by a bullish one, or vice versa.
- Weekly levels are represented by dashed lines, while monthly levels are solid, providing clear visual differentiation.
- Levels are drawn at the open price of the reversal candle, starting precisely at the beginning of the new HTF bar.
Why It's Different:
- Focuses on genuine shifts in market sentiment rather than arbitrary price points.
- Automatically manages the number of visible levels to prevent chart clutter.
- Ideal for range traders and mean reversion strategies, offering insights into potential support and resistance zones where market participants have shown a change in behavior.
Usage Note:
While this indicator provides valuable insights, it should not be used in isolation. Always consider the broader market context and combine it with other analysis techniques for optimal results.
Settings:
- Toggle weekly/monthly levels
- Adjust the number of visible levels (1-20)
- Customize level colors
- Added Custom Timeframes
Notas de prensa
Added Custom Timeframe LevelsScript de código abierto
Fiel al espíritu de TradingView, el creador de este script lo ha convertido en código abierto, para que los traders puedan revisar y verificar su funcionalidad. ¡Enhorabuena al autor! Aunque puede utilizarlo de forma gratuita, recuerde que la republicación del código está sujeta a nuestras Normas internas.
Exención de responsabilidad
La información y las publicaciones no constituyen, ni deben considerarse como asesoramiento o recomendaciones financieras, de inversión, de trading o de otro tipo proporcionadas o respaldadas por TradingView. Más información en Condiciones de uso.
Script de código abierto
Fiel al espíritu de TradingView, el creador de este script lo ha convertido en código abierto, para que los traders puedan revisar y verificar su funcionalidad. ¡Enhorabuena al autor! Aunque puede utilizarlo de forma gratuita, recuerde que la republicación del código está sujeta a nuestras Normas internas.
Exención de responsabilidad
La información y las publicaciones no constituyen, ni deben considerarse como asesoramiento o recomendaciones financieras, de inversión, de trading o de otro tipo proporcionadas o respaldadas por TradingView. Más información en Condiciones de uso.