PROTECTED SOURCE SCRIPT
Keltner Platform
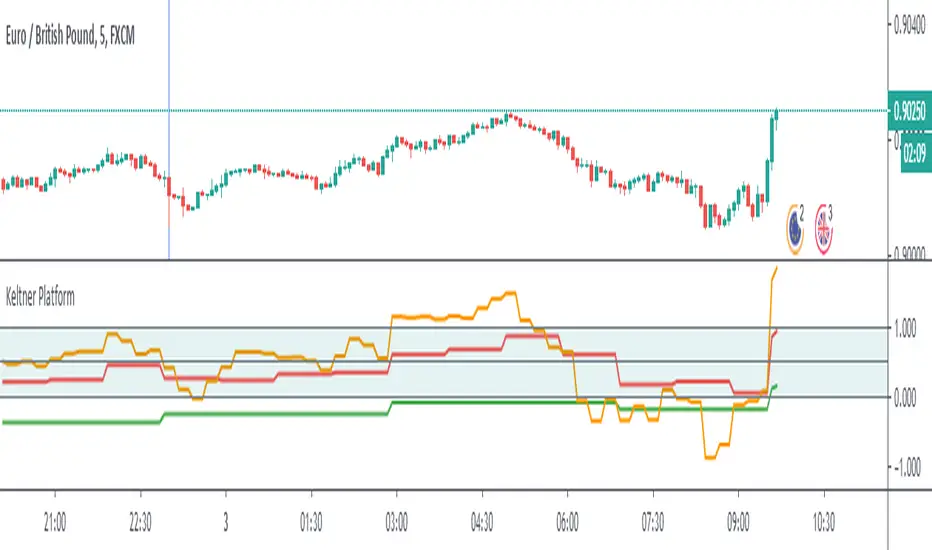
This script gives you the information on Keltner Channels in three or four different timeframes. I usually like to put the information from high-timeframe charts on the lower ones to see the bigger picture without switching. Keltner Platform gives you the idea of how far the price is from its moving average in the true range units.
BLACK - daily
GREEN - 4h
RED - 1h
ORANGE - 15 m if the timeframe is below 1h
How to remember colours? Black is ground, green are plants growing on it, red is the flame, orange is lower temperature flame. This is how they should be settled when all timeframes are in an early uptrend.
You can use different MA types for calculation, simple is recommended (by me).
Have a great trade!
Script protegido
Este script se publica como código cerrado. No obstante, puede utilizarlo libremente y sin ninguna limitación. Obtenga más información aquí.
Exención de responsabilidad
La información y las publicaciones no constituyen, ni deben considerarse como asesoramiento o recomendaciones financieras, de inversión, de trading o de otro tipo proporcionadas o respaldadas por TradingView. Más información en Condiciones de uso.