OPEN-SOURCE SCRIPT
MM8 Best Regression Channel
MM8 Best Regression Channel — Smart regression channel with auto-optimized length and density histogram
\Summary\
This indicator automatically searches the optimal regression length (optimalLength) between 50 and 200 (step 5) and draws a channel whose effective width is minimized. It then overlays a color-gradient regression channel plus a compact, right-edge density histogram to show where price spends most of its time inside the channel. The goal is to blend mean-reversion context with breakout assessment in a clean, visual way.
\How it works\
1. Length optimization: For each candidate length (50…200, step 5) the script computes variance of the source and its linear correlation with time (bar\_index). Residual volatility (MAD proxy) is estimated via sqrt(v − v\*r^2). The channel width is evaluated as 2×MAD with an internal optimizer multiplier (mult\_opt = 2.0). The length that yields the smallest effective width is selected as optimalLength.
2. Regression and channel: Using optimalLength, the slope (alpha) and intercept (beta) are derived from source vs. bar\_index. Upper/lower channel boundaries are set at ±MAD scaled by the user “Multiplier”.
3. Density histogram: The channel span is split into N bins. For each bin, the script counts how many of the last optimalLength bars fall inside that band and draws a short horizontal tick on the right edge. Longer ticks imply higher dwell time.
\Inputs\
* Bins Number: number of histogram bands (default 7).
* Multiplier: scales the final channel width used for drawing (separate from mult\_opt used only in the optimizer).
* Source: input data (default Close).
* Style → Show Histogram: toggle the right-edge density ticks.
* Style → Channel Color (Lower/Upper): colors for the channel gradient (from lower to upper).
* Style → Histogram Bins Color: color for the right-edge ticks.
* Style → Line Style: channel line style (solid / dashed / dotted).
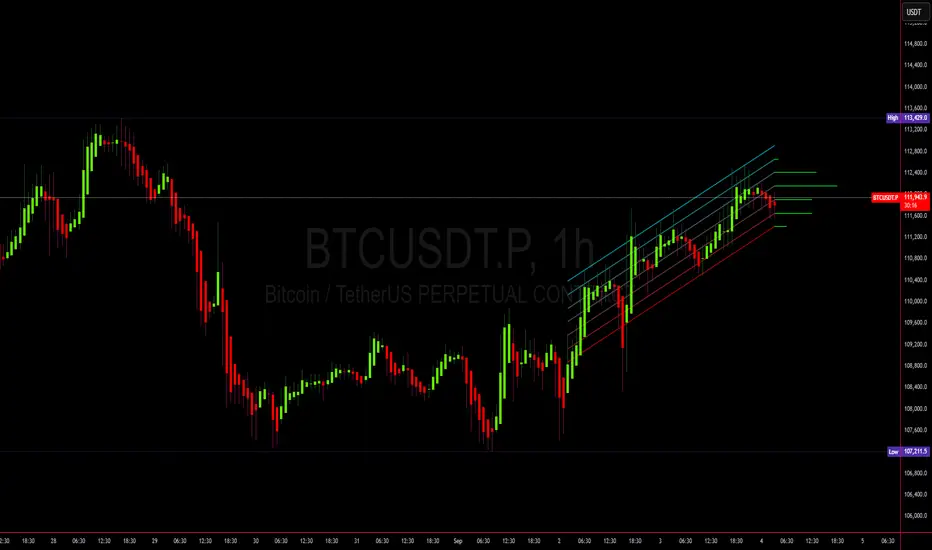
\What you see\
* A regression channel rendered with a lower→upper color gradient.
* A right-edge horizontal histogram for each band; tick length encodes the count of bars residing in that band over the last optimalLength window.
* To reduce overhead, lines are deleted/rebuilt and the drawing routine executes on the last bar (barstate.islast).
\Interpretation and use\
* Mean reversion: Touches or brief pierces of outer bands with low local density can suggest short-term fade setups.
* Breakout context: A sustained push with rising density near a boundary, backed by structure and volume, can support continuation.
* Multiplier tuning: Smaller → tighter/more sensitive channel; larger → smoother/less noisy.
* Bins tuning: More bins give finer distribution detail (at the cost of a busier plot).
\Practical notes\
* On noisier symbols/timeframes, consider a larger Multiplier.
* If the right-edge histogram looks too crowded, reduce Bins or increase Multiplier.
* Combine with market structure (HH/HL/LH/LL), volume, and supply/demand zones for confirmation.
\Limitations\
* The optimizer search range is fixed at 50…200 with step 5 for simplicity/performance. Adjust start\_length / end\_length / step\_length in code if you need a different space.
* Lines are rebuilt each update; many instances or very long histories can add overhead on weaker machines.
* This is a contextual tool, not a definitive buy/sell signal.
\Recommended settings\
* Many crypto pairs work well on 15m to 4h for a good balance of noise vs. signal.
* In strong trends, increase Multiplier or demand structural confirmation before fading an outer band.
* In ranges, focus on outer-band reactions with low local density and seek quick re-entries.
\Compatibility\
* Pine Script v5. Uses max\_lines\_count=500. When running multiple instances, monitor performance.
\Disclaimer\
* This is for analytical/educational purposes only and does not constitute financial advice. Use at your own risk.
Keywords: Regression Channel, Linear Regression, MAD, Mean Reversion, Breakout, Volatility, Distribution, Histogram, Liquidity, Crypto, BTC, Technical Analysis
\Summary\
This indicator automatically searches the optimal regression length (optimalLength) between 50 and 200 (step 5) and draws a channel whose effective width is minimized. It then overlays a color-gradient regression channel plus a compact, right-edge density histogram to show where price spends most of its time inside the channel. The goal is to blend mean-reversion context with breakout assessment in a clean, visual way.
\How it works\
1. Length optimization: For each candidate length (50…200, step 5) the script computes variance of the source and its linear correlation with time (bar\_index). Residual volatility (MAD proxy) is estimated via sqrt(v − v\*r^2). The channel width is evaluated as 2×MAD with an internal optimizer multiplier (mult\_opt = 2.0). The length that yields the smallest effective width is selected as optimalLength.
2. Regression and channel: Using optimalLength, the slope (alpha) and intercept (beta) are derived from source vs. bar\_index. Upper/lower channel boundaries are set at ±MAD scaled by the user “Multiplier”.
3. Density histogram: The channel span is split into N bins. For each bin, the script counts how many of the last optimalLength bars fall inside that band and draws a short horizontal tick on the right edge. Longer ticks imply higher dwell time.
\Inputs\
* Bins Number: number of histogram bands (default 7).
* Multiplier: scales the final channel width used for drawing (separate from mult\_opt used only in the optimizer).
* Source: input data (default Close).
* Style → Show Histogram: toggle the right-edge density ticks.
* Style → Channel Color (Lower/Upper): colors for the channel gradient (from lower to upper).
* Style → Histogram Bins Color: color for the right-edge ticks.
* Style → Line Style: channel line style (solid / dashed / dotted).
\What you see\
* A regression channel rendered with a lower→upper color gradient.
* A right-edge horizontal histogram for each band; tick length encodes the count of bars residing in that band over the last optimalLength window.
* To reduce overhead, lines are deleted/rebuilt and the drawing routine executes on the last bar (barstate.islast).
\Interpretation and use\
* Mean reversion: Touches or brief pierces of outer bands with low local density can suggest short-term fade setups.
* Breakout context: A sustained push with rising density near a boundary, backed by structure and volume, can support continuation.
* Multiplier tuning: Smaller → tighter/more sensitive channel; larger → smoother/less noisy.
* Bins tuning: More bins give finer distribution detail (at the cost of a busier plot).
\Practical notes\
* On noisier symbols/timeframes, consider a larger Multiplier.
* If the right-edge histogram looks too crowded, reduce Bins or increase Multiplier.
* Combine with market structure (HH/HL/LH/LL), volume, and supply/demand zones for confirmation.
\Limitations\
* The optimizer search range is fixed at 50…200 with step 5 for simplicity/performance. Adjust start\_length / end\_length / step\_length in code if you need a different space.
* Lines are rebuilt each update; many instances or very long histories can add overhead on weaker machines.
* This is a contextual tool, not a definitive buy/sell signal.
\Recommended settings\
* Many crypto pairs work well on 15m to 4h for a good balance of noise vs. signal.
* In strong trends, increase Multiplier or demand structural confirmation before fading an outer band.
* In ranges, focus on outer-band reactions with low local density and seek quick re-entries.
\Compatibility\
* Pine Script v5. Uses max\_lines\_count=500. When running multiple instances, monitor performance.
\Disclaimer\
* This is for analytical/educational purposes only and does not constitute financial advice. Use at your own risk.
Keywords: Regression Channel, Linear Regression, MAD, Mean Reversion, Breakout, Volatility, Distribution, Histogram, Liquidity, Crypto, BTC, Technical Analysis
Script de código abierto
Siguiendo fielmente el espíritu de TradingView, el creador de este script lo ha publicado en código abierto, permitiendo que otros traders puedan revisar y verificar su funcionalidad. ¡Enhorabuena al autor! Puede utilizarlo de forma gratuita, pero tenga en cuenta que la publicación de este código está sujeta a nuestras Normas internas.
Exención de responsabilidad
La información y las publicaciones que ofrecemos, no implican ni constituyen un asesoramiento financiero, ni de inversión, trading o cualquier otro tipo de consejo o recomendación emitida o respaldada por TradingView. Puede obtener información adicional en las Condiciones de uso.