OPEN-SOURCE SCRIPT
Actualizado GeoMean+
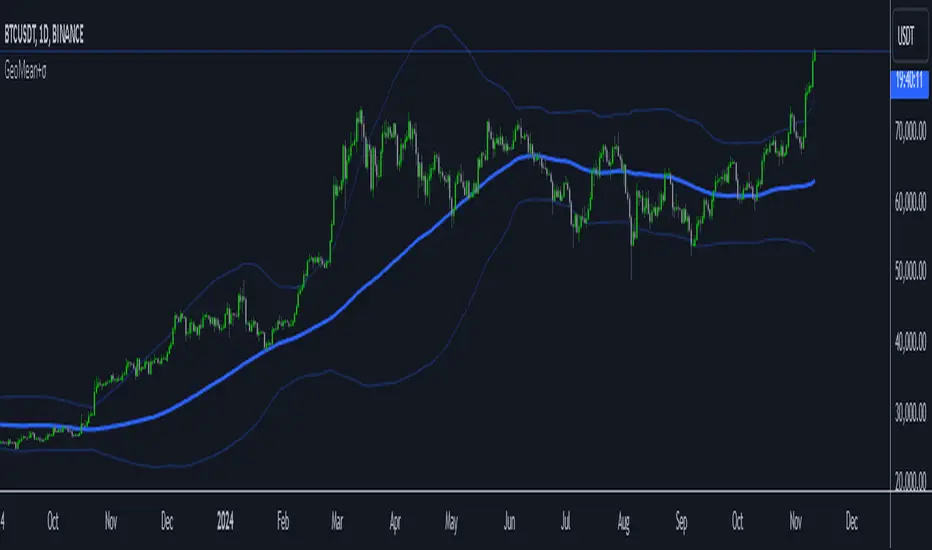
The Geometric Moving Average (GMA) with Sigma Bands is a technical indicator that combines trend following and volatility measurement. The blue center line represents the GMA, while the upper and lower bands (light blue) show price volatility using standard deviations (sigma). Traders can use this indicator for both trend following and mean reversion strategies. For trend following, enter long when price crosses above the GMA and short when it crosses below, using the bands as profit targets. For mean reversion, look for buying opportunities when price touches the lower band and selling opportunities at the upper band, with the GMA as your profit target. The indicator includes alerts for band touches and crosses, providing real-time notifications with symbol, timeframe, current price, and band level information. The default 100-period setting works well for daily charts, but can be adjusted shorter (20-50) for intraday trading or longer (200+) for position trading. Wider bands indicate higher volatility (use smaller positions), while narrower bands suggest lower volatility (larger positions possible). For best results, confirm signals with volume and avoid trading against strong trends. Stop losses can be placed beyond the touched band or at the GMA line, depending on your risk tolerance.
Notas de prensa
- added filter to display extreme areas
Notas de prensa
- updated alert message
Script de código abierto
Fiel al espíritu de TradingView, el creador de este script lo ha convertido en código abierto, para que los traders puedan revisar y verificar su funcionalidad. ¡Enhorabuena al autor! Aunque puede utilizarlo de forma gratuita, recuerde que la republicación del código está sujeta a nuestras Normas internas.
Exención de responsabilidad
La información y las publicaciones no constituyen, ni deben considerarse como asesoramiento o recomendaciones financieras, de inversión, de trading o de otro tipo proporcionadas o respaldadas por TradingView. Más información en Condiciones de uso.