OPEN-SOURCE SCRIPT
FT-RSI
Summary of the Custom RSI Indicator Script (For Futu Niuniu Platform):
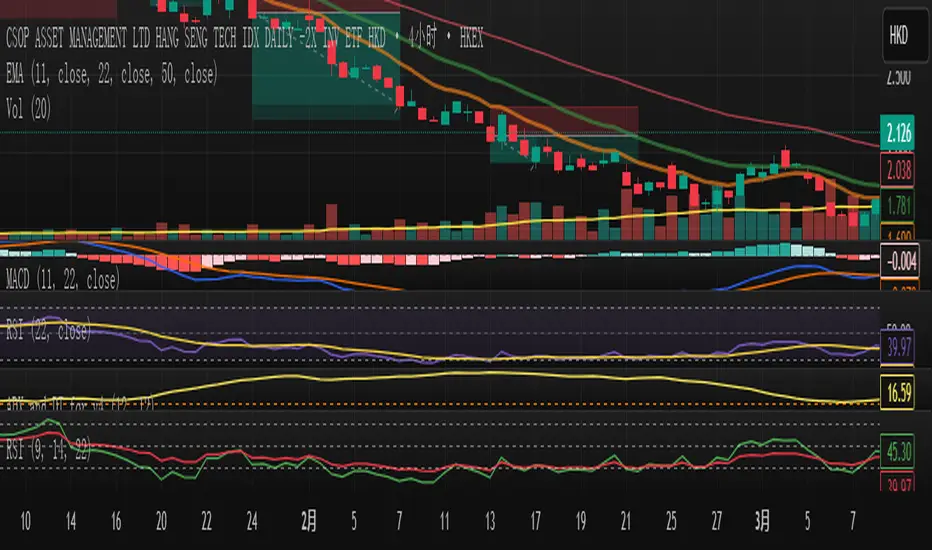
This Pine Script code implements a triple-period RSI indicator with horizontal reference lines (70, 50, 30) for technical analysis on the Futu Niuniu trading platform.
Key Features:
Multi-period RSI Calculation:
Computes three RSI values using 9, 14, and 22-period lengths to capture short-term, standard, and smoothed momentum signals.
Utilizes the Relative Moving Average (RMA) method for RSI calculation (ta.rma function).
Horizontal Reference Bands:
Upper Band (70): Red dotted line (semi-transparent) to identify overbought conditions.
Middle Band (50): Green dotted line as the neutral equilibrium level.
Lower Band (30): Blue dotted line (semi-transparent) to highlight oversold zones.
Visual Customization:
Distinct colors for each RSI line:
RSI (9): Orange (#F79A00)
RSI (14): Green (#49B50D)
RSI (22): Blue (#5188FF)
All lines have a thickness of 2 pixels for clear visibility.
Platform Compatibility:
This script is designed for Futu Niuniu’s charting system, leveraging Pine Script syntax adaptations supported by the platform. The horizontal bands and multi-period RSI logic help traders analyze trend strength and potential reversal points efficiently.
Note: Ensure Futu Niuniu’s scripting environment supports ta.rma and hline functions for proper execution.
Script de código abierto
Fiel al espíritu de TradingView, el creador de este script lo ha convertido en código abierto, para que los traders puedan revisar y verificar su funcionalidad. ¡Enhorabuena al autor! Aunque puede utilizarlo de forma gratuita, recuerde que la republicación del código está sujeta a nuestras Normas internas.
Exención de responsabilidad
La información y las publicaciones no constituyen, ni deben considerarse como asesoramiento o recomendaciones financieras, de inversión, de trading o de otro tipo proporcionadas o respaldadas por TradingView. Más información en Condiciones de uso.