PROTECTED SOURCE SCRIPT
Actualizado Angelleal Trading Suite v0.2.0

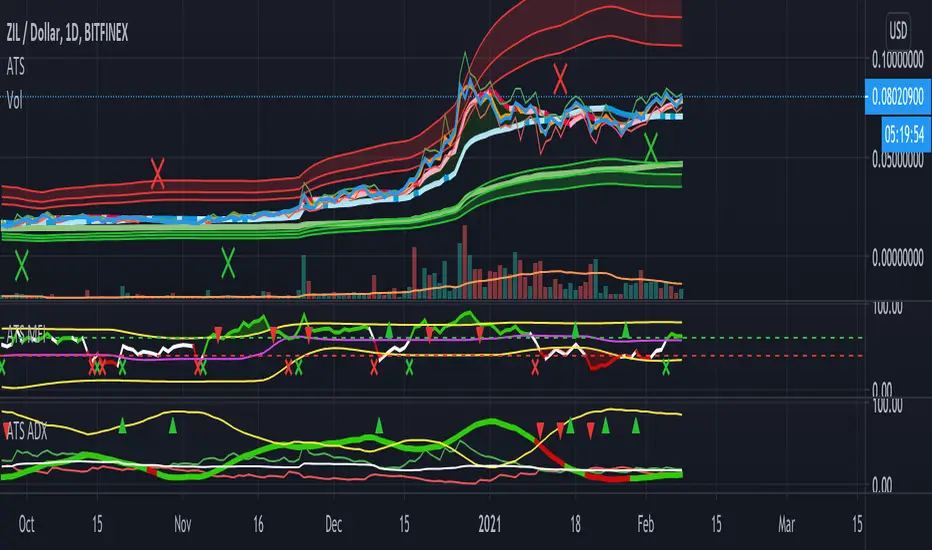
This script is built to condense the main indicators or levels i use for my strategy.
Support & Resistance
Draws the support and resistance levels on the current timeframe, with labels for the latest S/R formed.
The levels change color to reflect a role reversal depending on price action.
The number of bars used to confirm the formation of a new S/R level are configurable, but the default values are:
Moving Averages
The script uses 3 Moving Averages to calculate trend direction and posible dynamic supports and resistances for the trend.
Aditionally a couple of bands are drawed around the Medium Length moving average in conjuction with the ATR to account for
the volatility of the instrument.
The default values for the moving averages are:
Note: Most of the default values are set taking into account the Daily timeframe and natural divisions in it such as weeks, months and years. These values work well in other timeframes but might be adjusted
to get a better fit to the desired market and timeframe
Support & Resistance
Draws the support and resistance levels on the current timeframe, with labels for the latest S/R formed.
The levels change color to reflect a role reversal depending on price action.
The number of bars used to confirm the formation of a new S/R level are configurable, but the default values are:
- 30 bars to check before a new level
- 15 bars to check after a new level
- 5 bars used for early detection
Moving Averages
The script uses 3 Moving Averages to calculate trend direction and posible dynamic supports and resistances for the trend.
Aditionally a couple of bands are drawed around the Medium Length moving average in conjuction with the ATR to account for
the volatility of the instrument.
The default values for the moving averages are:
- Short MA Length - 7
- Medium MA Length - 30
- Long MA Length - 360
- ATR Multiplier for narrow band - 1.2
- ATR Multiplier for wide band - 3.6
Note: Most of the default values are set taking into account the Daily timeframe and natural divisions in it such as weeks, months and years. These values work well in other timeframes but might be adjusted
to get a better fit to the desired market and timeframe
Notas de prensa
Fixed S/R labels positioningNotas de prensa
Adds labels to pivots and changes style and default valuesNotas de prensa
New trend systemScript protegido
Este script se publica como código cerrado. No obstante, puede utilizarlo libremente y sin ninguna limitación. Obtenga más información aquí.
Exención de responsabilidad
La información y las publicaciones no constituyen, ni deben considerarse como asesoramiento o recomendaciones financieras, de inversión, de trading o de otro tipo proporcionadas o respaldadas por TradingView. Más información en Condiciones de uso.
Script protegido
Este script se publica como código cerrado. No obstante, puede utilizarlo libremente y sin ninguna limitación. Obtenga más información aquí.
Exención de responsabilidad
La información y las publicaciones no constituyen, ni deben considerarse como asesoramiento o recomendaciones financieras, de inversión, de trading o de otro tipo proporcionadas o respaldadas por TradingView. Más información en Condiciones de uso.