OPEN-SOURCE SCRIPT
Actualizado US Yield Curve (2-10yr)
US Yield Curve (2-10yr) by oonoon
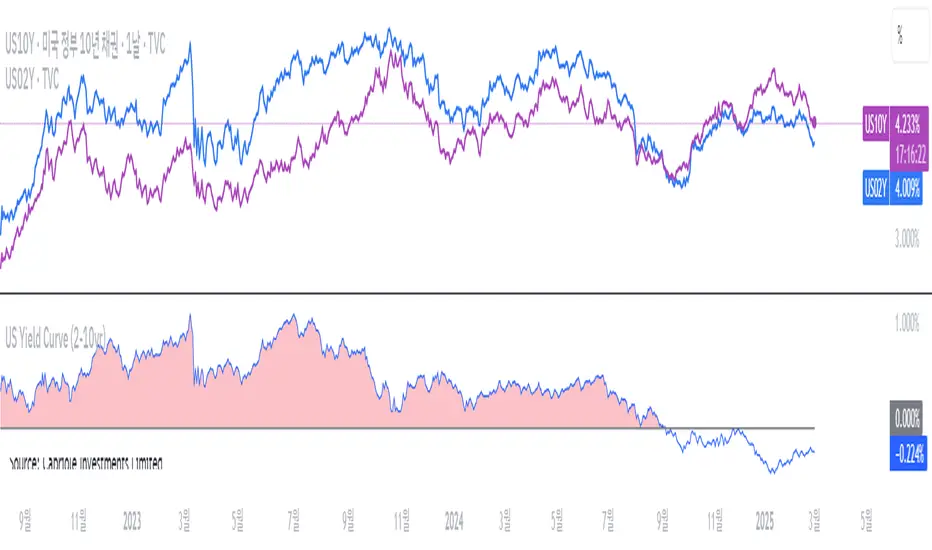
2-10Y US Yield Curve and Investment Strategies
The 2-10 year US Treasury yield spread measures the difference between the 10-year and 2-year Treasury yields. It is a key indicator of economic conditions.
Inversion (Spread < 0%): When the 2-year yield exceeds the 10-year yield, it signals a potential recession. Investors may shift to long-term bonds (TLT, ZROZ), gold (GLD), or defensive stocks.
Steepening (Spread widening): A rising 10-year yield relative to the 2-year suggests economic expansion. Investors can benefit by shorting bonds (TBT) or investing in financial stocks (XLF). The Amundi US Curve Steepening 2-10Y ETF can be used to profit from this trend.
Monitoring the curve: Traders can track US10Y-US02Y on TradingView for real-time insights and adjust portfolios accordingly.
Notas de prensa
2-10Y US Yield Curve and Investment Strategies by oonoonThe 2-10 year US Treasury yield spread measures the difference between the 10-year and 2-year Treasury yields. It is a key indicator of economic conditions.
Inversion (Spread < 0%): When the 2-year yield exceeds the 10-year yield, it signals a potential recession. Investors may shift to long-term bonds (TLT, ZROZ), gold (GLD), or defensive stocks.
Steepening (Spread widening): A rising 10-year yield relative to the 2-year suggests economic expansion. Investors can benefit by shorting bonds (TBT) or investing in financial stocks (XLF). The Amundi US Curve Steepening 2-10Y ETF can be used to profit from this trend.
Monitoring the curve: Traders can track US10Y-US02Y on TradingView for real-time insights and adjust portfolios accordingly.
Script de código abierto
Fiel al espíritu de TradingView, el creador de este script lo ha convertido en código abierto, para que los traders puedan revisar y verificar su funcionalidad. ¡Enhorabuena al autor! Aunque puede utilizarlo de forma gratuita, recuerde que la republicación del código está sujeta a nuestras Normas internas.
Exención de responsabilidad
La información y las publicaciones no constituyen, ni deben considerarse como asesoramiento o recomendaciones financieras, de inversión, de trading o de otro tipo proporcionadas o respaldadas por TradingView. Más información en Condiciones de uso.