Trend, Chart Patterns & Market Structure Indicator [TradeDots]
📝 HOW IT WORKS
Pivot Identification
The indicator detects pivots in price action using a complex mathematical model by analyzing a window of candlesticks to capture significant reversal patterns. It examines a series of bars, focusing on their open, high, low, close, and changes in these values, to pinpoint potential market turning points.
Support and Resistance Lines
- Calculation: Automatically draws lines at key price pivots in bullish and bearish markets.
- Significance: Aligning support and resistance levels highlights strong demand or supply zones, reinforcing trading biases. When multiple lines converge near a price level, it indicates robust support or resistance, as many traders focus on these levels for placing trades.
Chart Patterns Analysis
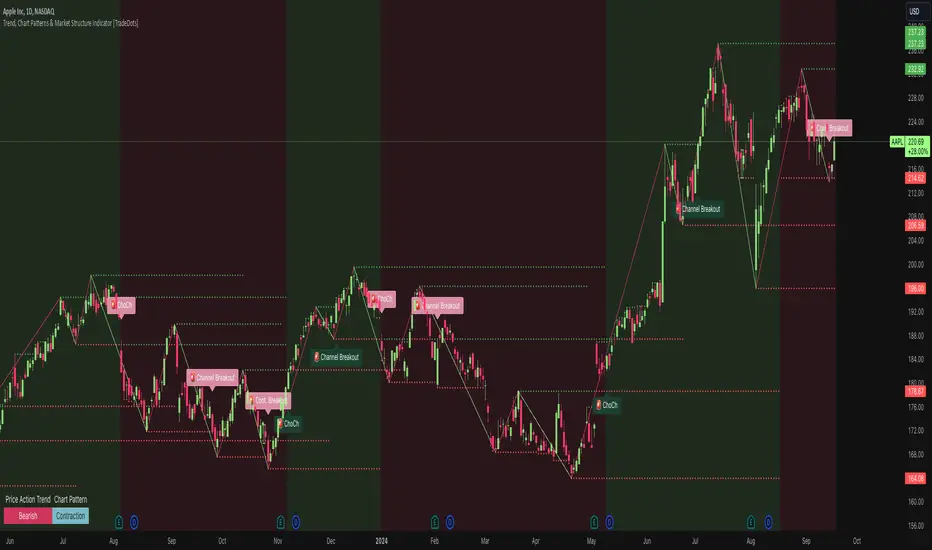
- Formation: Utilizes four pivots to identify patterns such as ascending/descending channels, contraction, and expansion patterns.
- Visualization: Background colors (green for bullish, red for bearish) help identify market trends.
Market Structure Shifts
- Detection: Identifies price breakouts above or below previous support and resistance, indicating changes in market structure.
- Confirmation: Highlights shifts in market character, aiding in trend reversal anticipation.
Types of Market Structure Shifts
- Channel Breakout: The price breaks out from the current channel's resistance level.
- Rev. Breakout: The price breaks out from a contraction pattern, moving in the opposite direction of the previous market trend.
- Continuation Breakout: The price breaks out from a contraction pattern, continuing the previous market trend.
- Change of Character (ChoCh): The price breaks out from either support or resistance, causing a change in the market trend.
🛠️ HOW TO USE
Chart Visualization
- Color Coding: Background colors signify market trends, with green indicating bullish and red indicating bearish conditions.
- Pattern Recognition: Identifies and labels patterns, providing insights into current market sentiment.
Reversal Signals
- Signal Labels: Detects shifts in market structure indicating potential entry and exit points.
❗️LIMITATIONS
- Market Noise: Accuracy may decrease in volatile and noisy markets.
- Trend Confirmation Delay: Market trends are only confirmed once the price breaks out from support or resistance, potentially causing delays.
RISK DISCLAIMER
Trading involves substantial risk, and most traders may incur losses. All content, tools, scripts, articles, and education provided by TradeDots are for informational and educational purposes only.
- Improved trend detector accuracy
- Minor bug fix
Script que requiere invitación
Solo los usuarios autorizados por el autor pueden acceder a este script. Deberá solicitar y obtener permiso para utilizarlo. Por lo general, este se concede tras realizar el pago. Para obtener más información, siga las instrucciones del autor indicadas a continuación o póngase en contacto directamente con tradedots.
TradingView NO recomienda pagar por un script ni utilizarlo a menos que confíe plenamente en su autor y comprenda cómo funciona. También puede encontrar alternativas gratuitas y de código abierto en nuestros scripts de la comunidad.
Instrucciones del autor
Exención de responsabilidad
Script que requiere invitación
Solo los usuarios autorizados por el autor pueden acceder a este script. Deberá solicitar y obtener permiso para utilizarlo. Por lo general, este se concede tras realizar el pago. Para obtener más información, siga las instrucciones del autor indicadas a continuación o póngase en contacto directamente con tradedots.
TradingView NO recomienda pagar por un script ni utilizarlo a menos que confíe plenamente en su autor y comprenda cómo funciona. También puede encontrar alternativas gratuitas y de código abierto en nuestros scripts de la comunidad.