PROTECTED SOURCE SCRIPT
Sortino Ratio -> PROFABIGHI_CAPITAL
🌟 Overview
This Sortino Ratio → PROFABIGHI_CAPITAL implements advanced risk-adjusted performance measurement focusing specifically on downside volatility for superior portfolio evaluation.
It provides Enhanced Sortino Ratio calculation with downside deviation analysis, Customizable risk-free rate benchmarking for different market environments, EMA smoothing for trend clarity and noise reduction, and Dynamic threshold-based visualization with performance classification for comprehensive risk-adjusted return analysis.
🔧 Advanced Risk Measurement Architecture
- Professional Sortino Ratio implementation focusing exclusively on downside risk measurement for accurate performance evaluation
- Source Selection Framework with customizable price input allowing close, high, low, or other price sources for flexible analysis adaptation
- Calculation Period Management with adjustable lookback period for statistical significance balancing responsiveness versus stability
- Annual Risk-Free Rate Configuration enabling benchmark comparison against government bonds, treasury rates, or other risk-free instruments
- EMA Smoothing System reducing noise and providing clearer trend identification through exponential moving average filtering
- Dynamic Threshold Framework with strong and weak performance classification levels for objective performance assessment
- Cryptocurrency Annualization using 365-day factor for proper crypto market risk-adjusted return calculation
📊 Sortino Ratio Calculation Engine
- Periodic Returns Computation calculating bar-to-bar percentage changes for accurate return measurement across different timeframes
- Risk-Free Rate Conversion transforming annual risk-free rates into period-appropriate benchmarks for proper comparison
- Mean Return Analysis using Simple Moving Average over calculation period for statistical trend identification
- Downside Deviation Framework measuring only negative deviations below risk-free rate for true downside risk assessment
- Mathematical Precision implementing squared deviation calculations for proper statistical variance measurement
- Zero-Division Protection preventing calculation errors through proper mathematical validation and edge case handling
- Annualization Factor Application scaling periodic calculations to annual equivalents for standardized performance comparison
🔬 Advanced Statistical Implementation
- Downside-Only Risk Measurement focusing exclusively on negative returns below risk-free threshold for accurate risk assessment
- Squared Deviation Accumulation using proper statistical methodology for variance calculation with mathematical precision
- Mean Downside Squared Calculation averaging squared negative deviations over calculation period for statistical accuracy
- Square Root Standard Deviation converting variance to standard deviation for proper risk measurement units
- Excess Return Calculation measuring portfolio performance above risk-free rate for true alpha generation assessment
- Mathematical Validation Framework ensuring proper handling of edge cases and preventing division by zero errors
- Statistical Significance using sufficient calculation periods for reliable Sortino Ratio measurement and trend identification
📈 EMA Smoothing and Trend Analysis
- Exponential Moving Average Application reducing short-term noise while preserving trend direction for clearer signal interpretation
- Smoothing Period Configuration balancing responsiveness versus stability through adjustable EMA length parameters
- Trend Persistence Analysis identifying sustained performance improvements or deteriorations through smoothed ratio tracking
- Signal Quality Enhancement filtering market noise while maintaining sensitivity to genuine performance changes
- Null Value Protection using nz() function to handle missing values and ensure continuous ratio calculation
- Real-Time Updates providing current smoothed Sortino values for immediate performance assessment and decision making
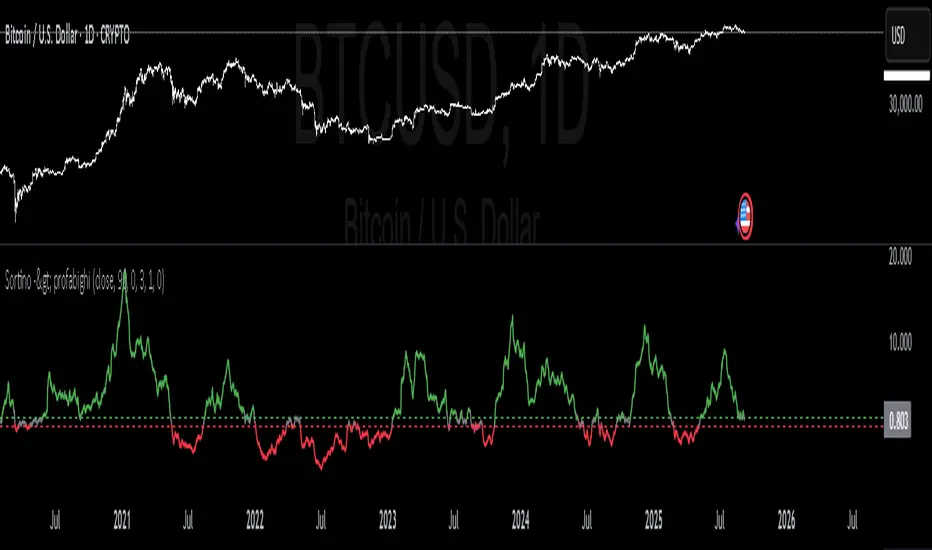
🎨 Dynamic Visualization Framework
- Performance-Based Color Coding using green for strong performance above upper threshold and red for weak performance below lower threshold
- Neutral Zone Visualization displaying gray coloring for performance between thresholds indicating moderate risk-adjusted returns
- Threshold Reference Lines showing strong and weak performance boundaries through horizontal dashed lines for clear performance classification
- Dynamic Line Width using prominent line display for clear trend identification and professional chart presentation
- Real-Time Color Updates adjusting visualization based on current performance relative to threshold settings
- Professional Styling implementing institutional-grade visual elements for serious portfolio analysis and performance tracking
⚖️ Risk-Adjusted Performance Assessment
- Downside Risk Focus measuring only negative volatility for more accurate risk assessment compared to traditional Sharpe ratio
- Asymmetric Risk Recognition acknowledging that upside volatility is desirable while downside volatility represents true risk
- Benchmark Relative Performance comparing returns against risk-free alternatives for absolute performance measurement
- Statistical Robustness using proper mathematical formulation for reliable risk-adjusted return calculation
- Performance Classification providing objective strong/weak performance thresholds for systematic evaluation
- Trend Analysis Capability identifying improving or deteriorating risk-adjusted performance through smoothed trending
🔍 Advanced Configuration Options
- Flexible Source Selection accommodating different price sources for various analysis requirements and asset characteristics
- Adaptive Calculation Periods allowing adjustment for different market conditions and analysis timeframes
- Risk-Free Rate Customization enabling comparison against various benchmarks including government bonds and treasury rates
- Smoothing Parameter Control balancing signal clarity versus responsiveness through adjustable EMA periods
- Performance Threshold Management setting custom strong and weak performance boundaries for specific strategy requirements
- Precision Control using three decimal places for accurate ratio measurement and detailed performance tracking
📊 Professional Portfolio Analysis Applications
- Strategy Performance Evaluation measuring risk-adjusted returns for trading strategy assessment and optimization
- Portfolio Comparison comparing multiple strategies or assets using standardized Sortino measurements
- Risk Management Integration identifying periods of poor risk-adjusted performance for strategy adjustment
- Benchmark Outperformance tracking excess returns above risk-free alternatives for alpha generation measurement
- Performance Monitoring continuous assessment of strategy effectiveness through smoothed ratio trending
- Institutional-Grade Analysis providing professional portfolio management metrics for serious investment analysis
🔧 Technical Implementation Features
- Mathematical Accuracy implementing proper Sortino formula with correct statistical methodology and precision handling
- Computational Efficiency using optimized loops and calculations for real-time performance measurement
- Error Prevention incorporating comprehensive validation and edge case handling for reliable operation
- Memory Management efficient variable usage and calculation methods for optimal indicator performance
- Real-Time Processing providing immediate updates with each new bar for current performance assessment
- Professional Standards following institutional portfolio analysis methodology for serious risk management applications
✅ Key Takeaways
- Advanced Sortino Ratio implementation focusing exclusively on downside risk for superior portfolio performance measurement
- Customizable risk-free rate benchmarking enabling comparison against various market alternatives and investment environments
- EMA smoothing system reducing noise while preserving trend identification for clearer performance signal interpretation
- Dynamic threshold-based visualization providing objective performance classification through color-coded strong/weak boundaries
- Professional statistical implementation using proper mathematical methodology for institutional-grade risk-adjusted return analysis
- Flexible configuration options accommodating different analysis requirements, timeframes, and market conditions
- Comprehensive risk management integration enabling continuous strategy performance monitoring and optimization for superior portfolio management
This Sortino Ratio → PROFABIGHI_CAPITAL implements advanced risk-adjusted performance measurement focusing specifically on downside volatility for superior portfolio evaluation.
It provides Enhanced Sortino Ratio calculation with downside deviation analysis, Customizable risk-free rate benchmarking for different market environments, EMA smoothing for trend clarity and noise reduction, and Dynamic threshold-based visualization with performance classification for comprehensive risk-adjusted return analysis.
🔧 Advanced Risk Measurement Architecture
- Professional Sortino Ratio implementation focusing exclusively on downside risk measurement for accurate performance evaluation
- Source Selection Framework with customizable price input allowing close, high, low, or other price sources for flexible analysis adaptation
- Calculation Period Management with adjustable lookback period for statistical significance balancing responsiveness versus stability
- Annual Risk-Free Rate Configuration enabling benchmark comparison against government bonds, treasury rates, or other risk-free instruments
- EMA Smoothing System reducing noise and providing clearer trend identification through exponential moving average filtering
- Dynamic Threshold Framework with strong and weak performance classification levels for objective performance assessment
- Cryptocurrency Annualization using 365-day factor for proper crypto market risk-adjusted return calculation
📊 Sortino Ratio Calculation Engine
- Periodic Returns Computation calculating bar-to-bar percentage changes for accurate return measurement across different timeframes
- Risk-Free Rate Conversion transforming annual risk-free rates into period-appropriate benchmarks for proper comparison
- Mean Return Analysis using Simple Moving Average over calculation period for statistical trend identification
- Downside Deviation Framework measuring only negative deviations below risk-free rate for true downside risk assessment
- Mathematical Precision implementing squared deviation calculations for proper statistical variance measurement
- Zero-Division Protection preventing calculation errors through proper mathematical validation and edge case handling
- Annualization Factor Application scaling periodic calculations to annual equivalents for standardized performance comparison
🔬 Advanced Statistical Implementation
- Downside-Only Risk Measurement focusing exclusively on negative returns below risk-free threshold for accurate risk assessment
- Squared Deviation Accumulation using proper statistical methodology for variance calculation with mathematical precision
- Mean Downside Squared Calculation averaging squared negative deviations over calculation period for statistical accuracy
- Square Root Standard Deviation converting variance to standard deviation for proper risk measurement units
- Excess Return Calculation measuring portfolio performance above risk-free rate for true alpha generation assessment
- Mathematical Validation Framework ensuring proper handling of edge cases and preventing division by zero errors
- Statistical Significance using sufficient calculation periods for reliable Sortino Ratio measurement and trend identification
📈 EMA Smoothing and Trend Analysis
- Exponential Moving Average Application reducing short-term noise while preserving trend direction for clearer signal interpretation
- Smoothing Period Configuration balancing responsiveness versus stability through adjustable EMA length parameters
- Trend Persistence Analysis identifying sustained performance improvements or deteriorations through smoothed ratio tracking
- Signal Quality Enhancement filtering market noise while maintaining sensitivity to genuine performance changes
- Null Value Protection using nz() function to handle missing values and ensure continuous ratio calculation
- Real-Time Updates providing current smoothed Sortino values for immediate performance assessment and decision making
🎨 Dynamic Visualization Framework
- Performance-Based Color Coding using green for strong performance above upper threshold and red for weak performance below lower threshold
- Neutral Zone Visualization displaying gray coloring for performance between thresholds indicating moderate risk-adjusted returns
- Threshold Reference Lines showing strong and weak performance boundaries through horizontal dashed lines for clear performance classification
- Dynamic Line Width using prominent line display for clear trend identification and professional chart presentation
- Real-Time Color Updates adjusting visualization based on current performance relative to threshold settings
- Professional Styling implementing institutional-grade visual elements for serious portfolio analysis and performance tracking
⚖️ Risk-Adjusted Performance Assessment
- Downside Risk Focus measuring only negative volatility for more accurate risk assessment compared to traditional Sharpe ratio
- Asymmetric Risk Recognition acknowledging that upside volatility is desirable while downside volatility represents true risk
- Benchmark Relative Performance comparing returns against risk-free alternatives for absolute performance measurement
- Statistical Robustness using proper mathematical formulation for reliable risk-adjusted return calculation
- Performance Classification providing objective strong/weak performance thresholds for systematic evaluation
- Trend Analysis Capability identifying improving or deteriorating risk-adjusted performance through smoothed trending
🔍 Advanced Configuration Options
- Flexible Source Selection accommodating different price sources for various analysis requirements and asset characteristics
- Adaptive Calculation Periods allowing adjustment for different market conditions and analysis timeframes
- Risk-Free Rate Customization enabling comparison against various benchmarks including government bonds and treasury rates
- Smoothing Parameter Control balancing signal clarity versus responsiveness through adjustable EMA periods
- Performance Threshold Management setting custom strong and weak performance boundaries for specific strategy requirements
- Precision Control using three decimal places for accurate ratio measurement and detailed performance tracking
📊 Professional Portfolio Analysis Applications
- Strategy Performance Evaluation measuring risk-adjusted returns for trading strategy assessment and optimization
- Portfolio Comparison comparing multiple strategies or assets using standardized Sortino measurements
- Risk Management Integration identifying periods of poor risk-adjusted performance for strategy adjustment
- Benchmark Outperformance tracking excess returns above risk-free alternatives for alpha generation measurement
- Performance Monitoring continuous assessment of strategy effectiveness through smoothed ratio trending
- Institutional-Grade Analysis providing professional portfolio management metrics for serious investment analysis
🔧 Technical Implementation Features
- Mathematical Accuracy implementing proper Sortino formula with correct statistical methodology and precision handling
- Computational Efficiency using optimized loops and calculations for real-time performance measurement
- Error Prevention incorporating comprehensive validation and edge case handling for reliable operation
- Memory Management efficient variable usage and calculation methods for optimal indicator performance
- Real-Time Processing providing immediate updates with each new bar for current performance assessment
- Professional Standards following institutional portfolio analysis methodology for serious risk management applications
✅ Key Takeaways
- Advanced Sortino Ratio implementation focusing exclusively on downside risk for superior portfolio performance measurement
- Customizable risk-free rate benchmarking enabling comparison against various market alternatives and investment environments
- EMA smoothing system reducing noise while preserving trend identification for clearer performance signal interpretation
- Dynamic threshold-based visualization providing objective performance classification through color-coded strong/weak boundaries
- Professional statistical implementation using proper mathematical methodology for institutional-grade risk-adjusted return analysis
- Flexible configuration options accommodating different analysis requirements, timeframes, and market conditions
- Comprehensive risk management integration enabling continuous strategy performance monitoring and optimization for superior portfolio management
Script protegido
Este script se publica como código cerrado. Sin embargo, puede utilizarlo libremente y sin limitaciones: obtenga más información aquí.
Exención de responsabilidad
La información y las publicaciones que ofrecemos, no implican ni constituyen un asesoramiento financiero, ni de inversión, trading o cualquier otro tipo de consejo o recomendación emitida o respaldada por TradingView. Puede obtener información adicional en las Condiciones de uso.