PROTECTED SOURCE SCRIPT
Actualizado Static Gann and EMAs

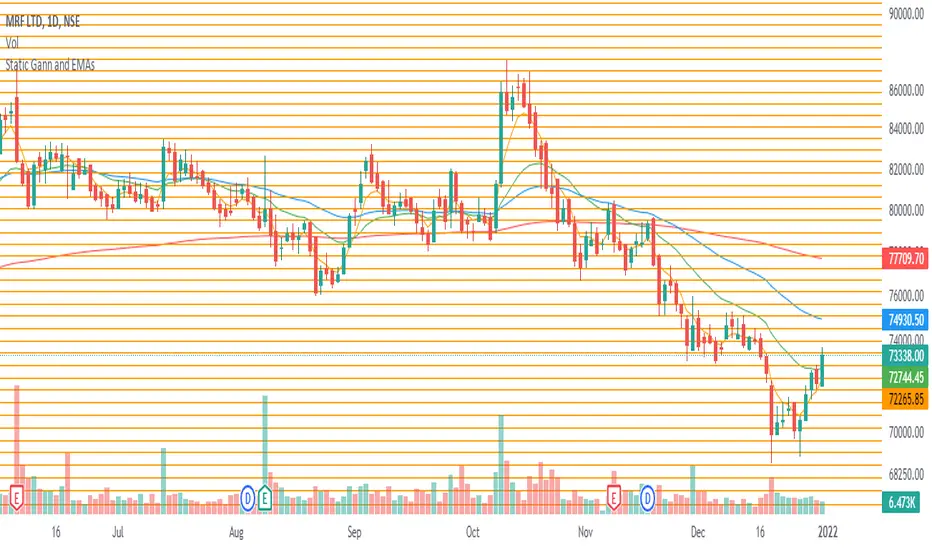
This indicator gives static Gann levels for 45 degree and 225 degree. These are helpful for identifying support and resistance levels under Gann Square of 9 method. The static levels are marked out in orange and are updated till 32761 (I could not find levels beyond this to update in my script and I apologise for the same) but if someone can provide them, then I shall update them to levels beyond this.
Additionally, there are multiple EMAs to give extra information which are also helpful in identifying support and resistance levels. EMAs included are for the period of 5, 21, 50 and 200.
How to use:
Just select the indicator and enable the EMA(s) you wish to plot on the chart.
Additionally, there are multiple EMAs to give extra information which are also helpful in identifying support and resistance levels. EMAs included are for the period of 5, 21, 50 and 200.
How to use:
Just select the indicator and enable the EMA(s) you wish to plot on the chart.
Notas de prensa
Thanks to Ajay Moreya who provided additional GANN levels. Now, GANN levels run above 100,000.Script protegido
Este script se publica como código cerrado. No obstante, puede utilizarlo libremente y sin ninguna limitación. Obtenga más información aquí.
Exención de responsabilidad
La información y las publicaciones no constituyen, ni deben considerarse como asesoramiento o recomendaciones financieras, de inversión, de trading o de otro tipo proporcionadas o respaldadas por TradingView. Más información en Condiciones de uso.
Script protegido
Este script se publica como código cerrado. No obstante, puede utilizarlo libremente y sin ninguna limitación. Obtenga más información aquí.
Exención de responsabilidad
La información y las publicaciones no constituyen, ni deben considerarse como asesoramiento o recomendaciones financieras, de inversión, de trading o de otro tipo proporcionadas o respaldadas por TradingView. Más información en Condiciones de uso.