kiska clouds
Crypto is a fast-paced, highly-volatile asset, therefore, many traditional strategies are thrown out of the window when applied to cryptocurrency markets. In trading, there are only two things known for sure: price and volume. Price and volume data is then manipulated using various math equations in an effort to discover patterns and/or make predictions. kiska clouds are no different.
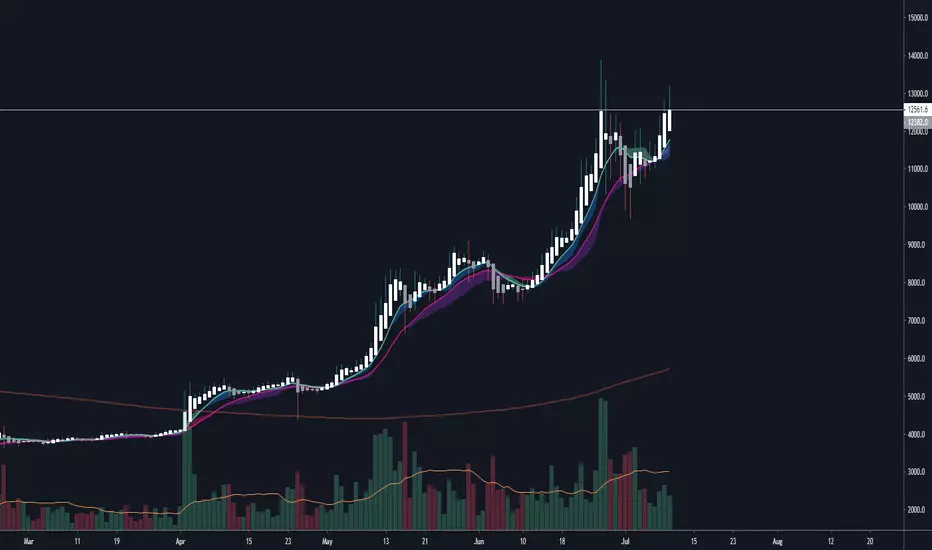
The kiska clouds are a simple crossover strategy. The clouds are different because of the unique averages being used and the embedded momentum indicator.
To use the clouds is simple:
- When the green line crosses above the pink line, you buy/long.
- When the green line crosses below the pink line, you sell/short.
The clouds are indicative of the trend's momentum. Using the power of math, the larger the cloud indicates a higher amount of buying/selling pressure. As the cloud thins, momentum is slowing, and the trend may be reversing.
At the time of testing, the strategy had a profitability of 54.55% accuracy with 1133.41% net profit. While I think this could be automated into a bot, adding a human element with stop losses and further analysis will significantly improve the accuracy/profitability.
This indicator is a "Pay What You Want" model. For a trial or to purchase this indicator, send me a message on Twitter moonkiska or here on TradingView. You will be granted a 2-3 day trial period to the backtesting strategy.
Tips:
- The higher the time frame, the more accurate the strategy.
- Personally, I do not short above the 200MA. I do not long below the 200MA.
Coming Soon:
- Support/Resistance
- Trend Lines
Script que requiere invitación
Solo los usuarios aprobados por el autor pueden acceder a este script. Deberá solicitar y obtener permiso para utilizarlo. Por lo general, este se concede tras realizar el pago. Para obtener más información, siga las instrucciones del autor que se indican a continuación o póngase en contacto directamente con moonkiska.
TradingView NO recomienda pagar por un script ni utilizarlo a menos que confíe plenamente en su autor y comprenda cómo funciona. También puede encontrar alternativas gratuitas y de código abierto en nuestros scripts de la comunidad.
Instrucciones del autor
Exención de responsabilidad
Script que requiere invitación
Solo los usuarios aprobados por el autor pueden acceder a este script. Deberá solicitar y obtener permiso para utilizarlo. Por lo general, este se concede tras realizar el pago. Para obtener más información, siga las instrucciones del autor que se indican a continuación o póngase en contacto directamente con moonkiska.
TradingView NO recomienda pagar por un script ni utilizarlo a menos que confíe plenamente en su autor y comprenda cómo funciona. También puede encontrar alternativas gratuitas y de código abierto en nuestros scripts de la comunidad.