OPEN-SOURCE SCRIPT
Rainbow Fisher - AYNET
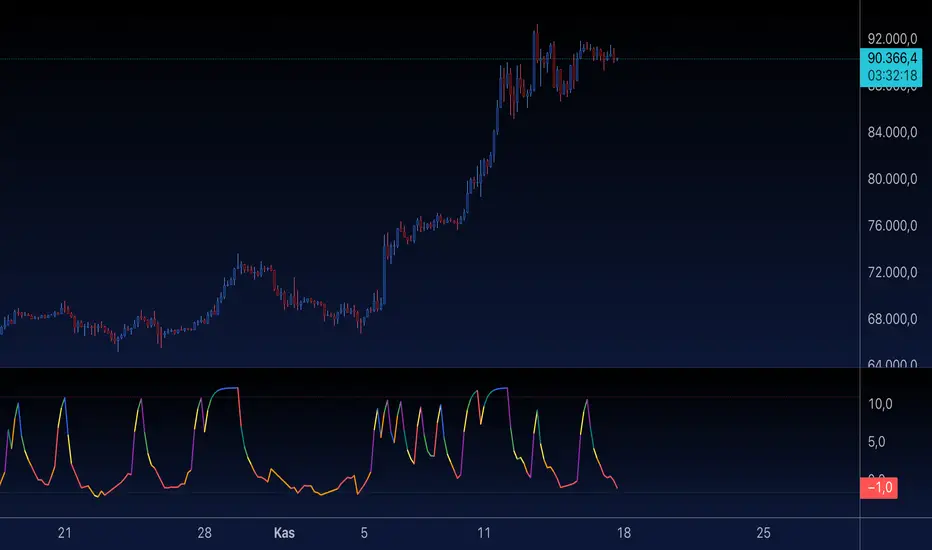
The Rainbow Fisher Indicator is inspired by John Ehlers' work on the Fisher Transform, a tool designed to normalize price movements and highlight overbought and oversold conditions. This script combines Ehlers' Fisher Transform with a rainbow visualization for enhanced trend analysis.
Summary of the Code
Fisher Transform Calculation:
The indicator calculates the Fisher Transform based on normalized high-low price data (hl2), which emphasizes turning points in market trends.
Rainbow Visualization:
The Fisher line is dynamically colored using a rainbow gradient to visually represent the magnitude and direction of market movements.
Overbought/Oversold Levels:
Configurable horizontal lines mark thresholds (1.5 for overbought and -1.5 for oversold by default), helping traders identify extremes in price action.
Signal Labels:
Labels are displayed when the Fisher line crosses the overbought or oversold levels, providing clear visual cues for potential market reversals.
Acknowledgment:
This indicator is an homage to John Ehlers' groundbreaking work in digital signal processing for financial markets.
How to Use
Trend Reversal Detection:
Use the overbought and oversold levels to identify potential turning points in market trends.
Momentum Analysis:
Observe the rainbow-colored Fisher line for directional cues and the strength of price movements.
Customization
Adjust the Fisher Transform length to refine sensitivity.
Modify overbought/oversold levels to align with your trading strategy.
Enable or disable the rainbow effect for simplicity or added clarity.
Let me know if you’d like further refinements or additional features! 🌈
Script de código abierto
Fiel al espíritu de TradingView, el creador de este script lo ha convertido en código abierto, para que los traders puedan revisar y verificar su funcionalidad. ¡Enhorabuena al autor! Aunque puede utilizarlo de forma gratuita, recuerde que la republicación del código está sujeta a nuestras Normas internas.
Exención de responsabilidad
La información y las publicaciones no constituyen, ni deben considerarse como asesoramiento o recomendaciones financieras, de inversión, de trading o de otro tipo proporcionadas o respaldadas por TradingView. Más información en Condiciones de uso.