PROTECTED SOURCE SCRIPT
Candles, average accumulation CTE

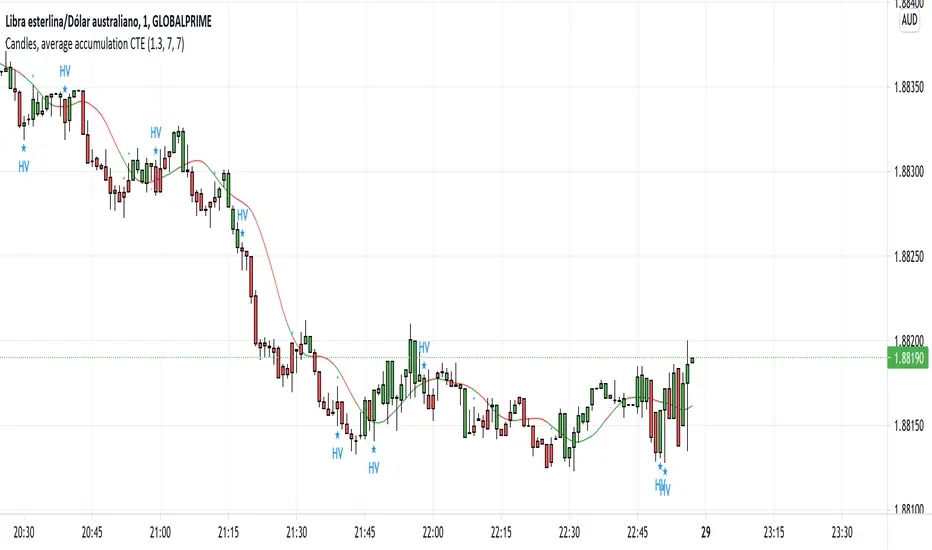
Hello everyone, this indicator is made to calculate the historical average cumulative volume, in the number configurable by the trader.
It is used to display bullish or bearish color in relation to the accumulation of historical volumes.
In the settings of the same indicator you can read the recommendations.
This indicator has 4 relevant data
1- Average accumulated volume, configurable by color
2- It shows us the climatic volume, based on the considerable and configurable increase in volume, in relation to the volume of the nearby candles.
3- It shows us a smoothed moving average, acting as support or dynamic resistance, this moving average should be used as a complement for the volume analysis, for example, if the color of the last candle appears in a negative accumulation color then we must wait that has force in movement with the crossing of the moving average.
In addition, this moving average is being used to perform anticipation calculations, based on short-term average accumulations of volume.
4- Anticipation calculations, the indicator shows us signs of "+" or "-" if the result of the early accumulation is being supported by climatic volume and in the same direction as the candle.
I hope this indicator is very useful so that you can keep in mind a relevant data such as the volume and the ease of visualization in space and time of the graph.
Script protegido
Este script se publica como código cerrado. No obstante, puede utilizarlo libremente y sin ninguna limitación. Obtenga más información aquí.
Exención de responsabilidad
La información y las publicaciones no constituyen, ni deben considerarse como asesoramiento o recomendaciones financieras, de inversión, de trading o de otro tipo proporcionadas o respaldadas por TradingView. Más información en Condiciones de uso.