Eagles Compass
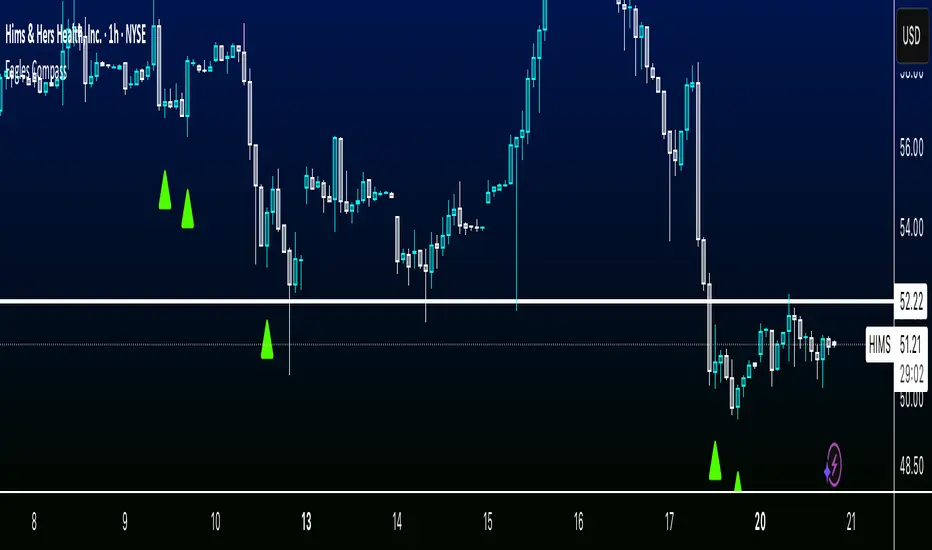
1HR, 2HR, 1D timeframe swing analysis script designed to help you spot squeezes, reversals, and large moves
Some stocks will work better on the 1HR timeframe, other stocks will have to be adjsuted to the 2HR or 1D timeframe based on volatility and average volume of the stock
There are some false positives as with any indicator. This is how you spot them:
If a red triangle appears near a support or new low and the stock is down quite a bit, or if it appears after the stock has already been down trending, it is invalid.
If a green triangle appears near a resistance or new high and the stock is already up a lot, or if it appears that the stock has been up trending for a while, it is invalid.
How does it work?
It's looking at key supports and resistances, reversal zones, and candle ratios to determine potential candles that might indicate an upcoming future move.
Script que requiere invitación
Solo los usuarios autorizados por el autor pueden acceder a este script. Tendrá que solicitar y obtener permiso para utilizarlo. Normalmente se concede previo pago. Para obtener más información, siga las instrucciones del autor o póngase en contacto directamente con zenmarkets.
TradingView NO recomienda pagar o utilizar un script a menos que confíe plenamente en su autor y entienda cómo funciona. También puede encontrar alternativas gratuitas de código abierto en nuestros scripts de la comunidad.
Instrucciones del autor
Exención de responsabilidad
Script que requiere invitación
Solo los usuarios autorizados por el autor pueden acceder a este script. Tendrá que solicitar y obtener permiso para utilizarlo. Normalmente se concede previo pago. Para obtener más información, siga las instrucciones del autor o póngase en contacto directamente con zenmarkets.
TradingView NO recomienda pagar o utilizar un script a menos que confíe plenamente en su autor y entienda cómo funciona. También puede encontrar alternativas gratuitas de código abierto en nuestros scripts de la comunidad.