OPEN-SOURCE SCRIPT
Actualizado liquidity volume

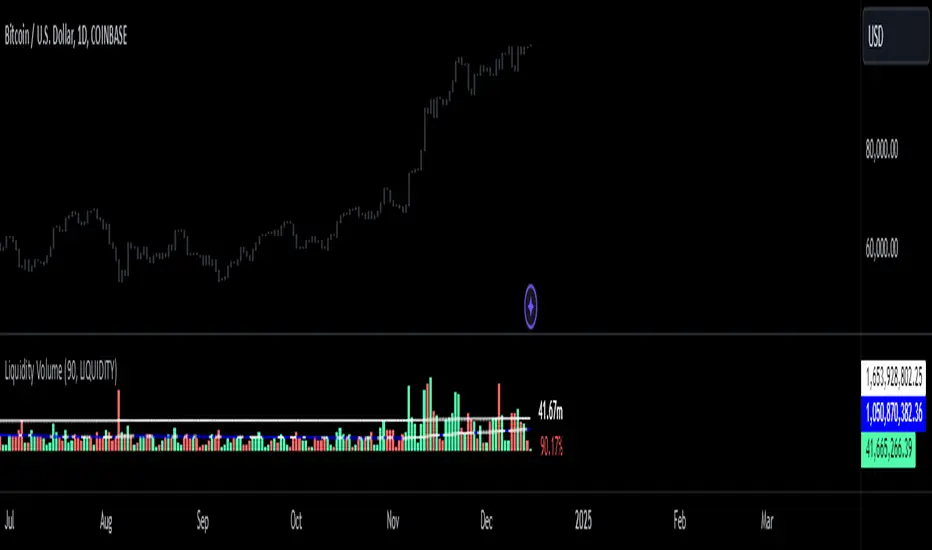
just like volume, this indicator shows how much in dollars were traded in millions.
Notas de prensa
made the volume bars represent colors based on bearish or bullish movementNotas de prensa
added a mean (average) to the script. Notas de prensa
added a 3rd standard deviation to the indicator. a 3sd occurrence has a 0.2% chance of occurrence on a statistical standpoint. but when it comes to markets it happens more often. nonetheless, a 3sd alert can signify a major market movement due to increase of activity of dollars going in or out of that asset you are observing. P.S.A. go on settings, under style tab, change the "price line" to a histogram. Notas de prensa
changed the plotted liqudity to a column Notas de prensa
when the line is purple that means that liquidity is going down. when the line is white that means liquidity is going up Notas de prensa
ive made improvements on the script. easier to use and readNotas de prensa
made a little bit more modificationNotas de prensa
you can switch from representation of liquidity and equity. equity is just normal volumeNotas de prensa
we have added a new stat. you can see how much volume has increased/decreased from the previous bar in percentageNotas de prensa
modified the separation of labels so no overlapping occursNotas de prensa
Script de código abierto
Fiel al espíritu de TradingView, el creador de este script lo ha convertido en código abierto, para que los traders puedan revisar y verificar su funcionalidad. ¡Enhorabuena al autor! Aunque puede utilizarlo de forma gratuita, recuerde que la republicación del código está sujeta a nuestras Normas internas.
Exención de responsabilidad
La información y las publicaciones no constituyen, ni deben considerarse como asesoramiento o recomendaciones financieras, de inversión, de trading o de otro tipo proporcionadas o respaldadas por TradingView. Más información en Condiciones de uso.