OPEN-SOURCE SCRIPT
Relative Price Oscillator
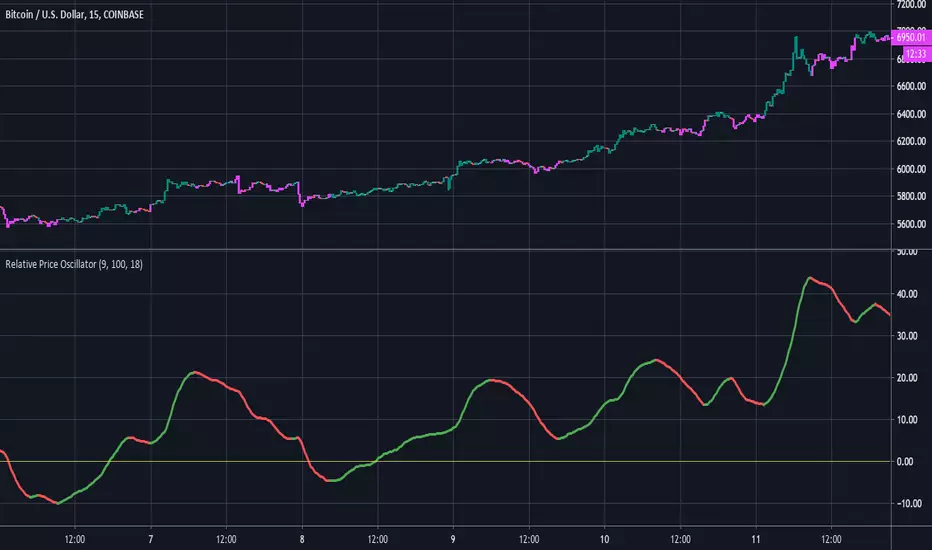
Here is a new experimental indicator we've been working on. The idea was to compare two EMA's of period midpoints to the actual closing price. The steps that were taken are listed below:
1.Calculate an EMA based on each period's midpoint ((High * Low) /2) for the last 9 periods.
2.Calculate an EMA based on each period's midpoint for the last 100 periods.
3. Divide the difference of the two EMA's by the closing price. ((EMA1 - EMA2) / Close).
4. Smooth the value from step #3 with an 18 period EMA. Multiply by 1000 for better scaling/visibility.
Using:
Bullish when line is green, bearish when line is red. Buy on first green, then sell on first red.
There is also an option to color the candles based on the RPO line.
Script de código abierto
Fiel al espíritu de TradingView, el creador de este script lo ha convertido en código abierto, para que los traders puedan revisar y verificar su funcionalidad. ¡Enhorabuena al autor! Aunque puede utilizarlo de forma gratuita, recuerde que la republicación del código está sujeta a nuestras Normas internas.
-Profit Programmers
profitprogrammer.com
profitprogrammer.com
Exención de responsabilidad
La información y las publicaciones no constituyen, ni deben considerarse como asesoramiento o recomendaciones financieras, de inversión, de trading o de otro tipo proporcionadas o respaldadas por TradingView. Más información en Condiciones de uso.