OPEN-SOURCE SCRIPT
EWMA Volatility Bands
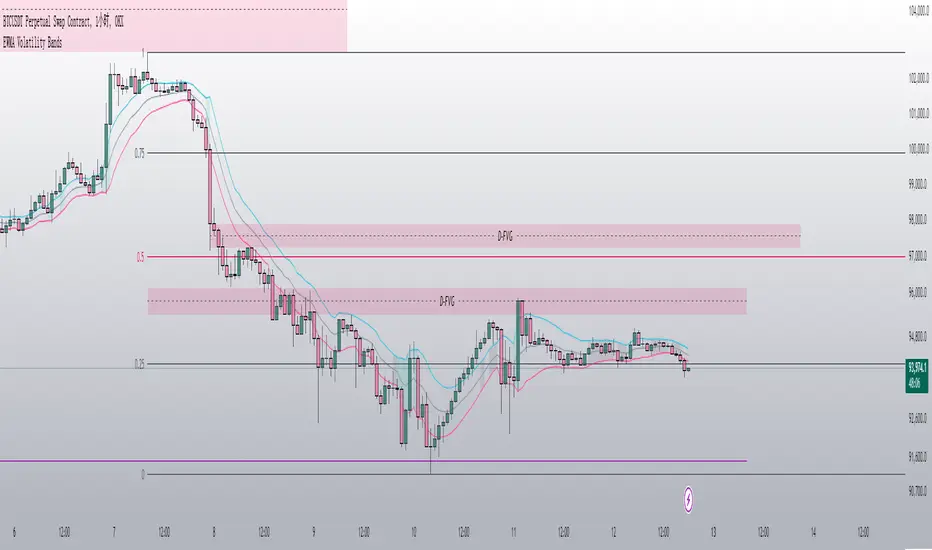
The EWMA Volatility Bands indicator combines an Exponential Moving Average (EMA) and Exponentially Weighted Moving Average (EWMA) of volatility to create dynamic upper and lower price bands. It helps traders identify trends, measure market volatility, and spot extreme conditions. Key features include:
Centerline (EMA): Tracks the trend based on a user-defined period.
Volatility Bands: Adjusted by the square root of volatility, representing potential price ranges.
Percentile Rank: Highlights extreme volatility (e.g., >99% or <1%) with shaded areas between the bands.
This tool is useful for trend-following, risk assessment, and identifying overbought/oversold conditions.
Script de código abierto
Fiel al espíritu de TradingView, el creador de este script lo ha convertido en código abierto, para que los traders puedan revisar y verificar su funcionalidad. ¡Enhorabuena al autor! Aunque puede utilizarlo de forma gratuita, recuerde que la republicación del código está sujeta a nuestras Normas internas.
Exención de responsabilidad
La información y las publicaciones no constituyen, ni deben considerarse como asesoramiento o recomendaciones financieras, de inversión, de trading o de otro tipo proporcionadas o respaldadas por TradingView. Más información en Condiciones de uso.