Ghost Vision III
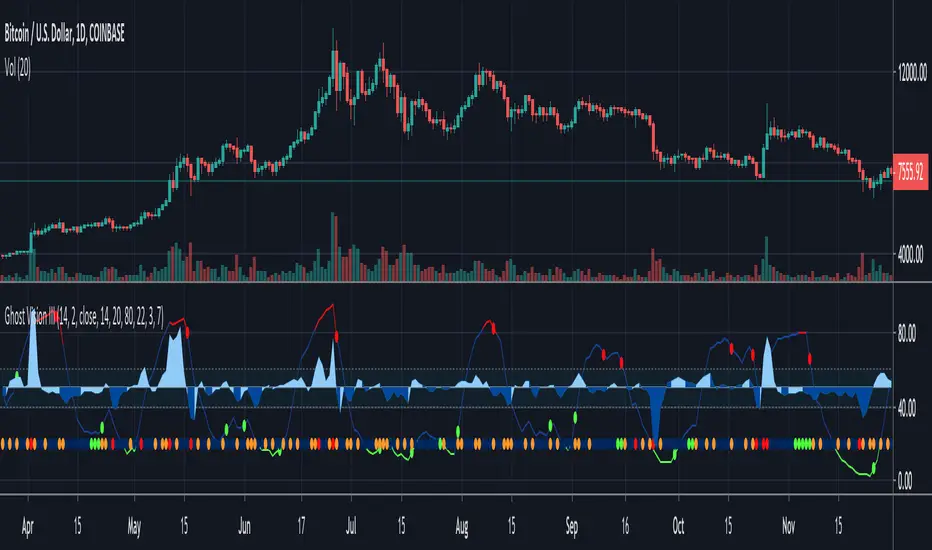
GhostVision III — Will answer you for the following questions:
Should I take a profit now?
The level amount of volume and price action?
Oversold or overbought?
Is it a pullback?
Can be used to:
Spot price moves that going to explode
Taking profit on extreme price movement
Spot fake price movements
Find pullback opportunities
Confirmations for GhostVision I & II
- Easier to use & see when and why we are overbought or oversold
- Double confirmation by line color and a dot (NEW)
For GhostVision Members:
Use it for a pullback strategy as an extra iceberg confirmation
Script que requiere invitación
Solo los usuarios autorizados por el autor pueden acceder a este script. Deberá solicitar y obtener permiso para utilizarlo. Por lo general, este se concede tras realizar el pago. Para obtener más información, siga las instrucciones del autor indicadas a continuación o póngase en contacto directamente con GhostVision.
TradingView NO recomienda pagar por un script ni utilizarlo a menos que confíe plenamente en su autor y comprenda cómo funciona. También puede encontrar alternativas gratuitas y de código abierto en nuestros scripts de la comunidad.
Instrucciones del autor
Exención de responsabilidad
Script que requiere invitación
Solo los usuarios autorizados por el autor pueden acceder a este script. Deberá solicitar y obtener permiso para utilizarlo. Por lo general, este se concede tras realizar el pago. Para obtener más información, siga las instrucciones del autor indicadas a continuación o póngase en contacto directamente con GhostVision.
TradingView NO recomienda pagar por un script ni utilizarlo a menos que confíe plenamente en su autor y comprenda cómo funciona. También puede encontrar alternativas gratuitas y de código abierto en nuestros scripts de la comunidad.