OPEN-SOURCE SCRIPT
TEMA Cross on Renko Candles
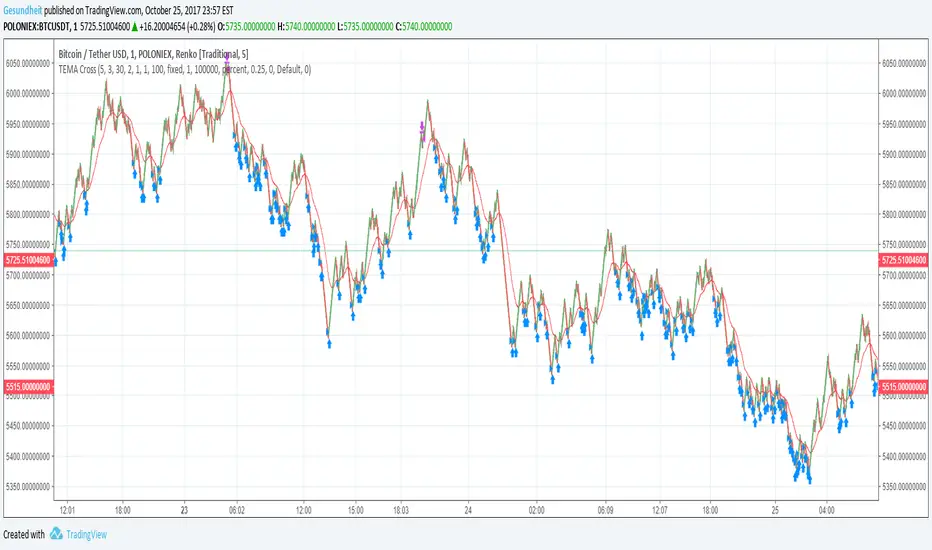
Renko candles filter out noise by plotting a fixed change in price rather than a fixed time frame.
Strategies like MACD or MA cross can give a lot of false signals when the price is wavy, but not actually going anywhere. This is especially a problem with small time frames.
Since it's so easy to identify trends on a Renko plot, this strategy uses a simple moving average cross idea. Instead of an EMA, we use a TEMA (triple exponential moving average) because that version does not lag as much.
We also will avoid buying when the price is above a longer-term smoothed moving average. This means we will hopefully reduce bags, but we will also miss some trades.
Also included are
avg_protection -- if >0 only buy when it will bring down our average price, else buy whenever the TEMA crosses over the short-term SMA
gain_protection -- if >0 only sell when we meet out min_gain %, otherwise sell whenever TEMA crosses under the short-term SMA
I've been setting my Renko candles to a fixed range instead of ATR, and I use increments of roughly 0.1% in the example chart.
Script de código abierto
Fiel al espíritu de TradingView, el creador de este script lo ha convertido en código abierto, para que los traders puedan revisar y verificar su funcionalidad. ¡Enhorabuena al autor! Aunque puede utilizarlo de forma gratuita, recuerde que la republicación del código está sujeta a nuestras Normas internas.
Exención de responsabilidad
La información y las publicaciones no constituyen, ni deben considerarse como asesoramiento o recomendaciones financieras, de inversión, de trading o de otro tipo proporcionadas o respaldadas por TradingView. Más información en Condiciones de uso.