OPEN-SOURCE SCRIPT
Actualizado Rolling Performance Metrics Table
Rolling Performance Metrics Table
A clean, customizable table overlay that displays rolling performance metrics across multiple time periods. Perfect for quickly assessing price momentum and performance trends at a glance.
FEATURES:
- Displays performance across 5 time periods: 1 Week, 3 Month, 6 Month, 1 Year, and 2 Year
- Shows historical price at the start of each period
- Calculates both absolute price change and percentage change
- Color-coded results: Green for positive performance, Red for negative performance
- Fully transparent design with no background or borders - text floats cleanly over your chart
- Customizable table position (9 placement options)
DISPLAY COLUMNS:
1. Period - The lookback timeframe
2. Price - The historical price at the start of the period
3. Change (Value) - Absolute price change from the period start
4. Change (%) - Percentage return over the period
CUSTOMIZATION:
- Adjust the number of bars for each period (default: 1 Week = 5 bars, 3 Month = 63 bars, 6 Month = 126 bars, 1 Year = 252 bars, 2 Year = 504 bars)
- Choose from 9 table positions: Top, Middle, Bottom combined with Left, Center, Right
- Default position: Middle Left
USAGE:
Perfect for traders who want to quickly assess momentum across multiple timeframes. The transparent overlay design ensures minimal obstruction of chart analysis while providing critical performance data at a glance.
NOTE:
- The table only appears on the last bar of your chart
- Customize bar counts in settings to match your specific timeframe needs (e.g., daily vs hourly charts)
- "N/A" appears when historical data is insufficient for the selected period
Notas de prensa
Rolling Performance Metrics - Quick ViewDisplays a transparent floating table showing stock performance across 5 key time periods:
- 1 Week, 3 Month, 6 Month, 1 Year, and 2 Year lookback windows
For each period, the table shows:
- Historical starting price
- Absolute price change (in currency units)
- Percentage return (color-coded: green = positive, red = negative)
Perfect for quick momentum analysis and multi-timeframe performance comparison at a glance. The borderless, transparent design keeps your chart clean while providing essential performance metrics.
```
Or if you want an even shorter version:
```
Clean performance table showing price changes and returns across 5 timeframes (1W to 2Y). Color-coded percentage gains (green) and losses (red) for quick visual analysis. Transparent overlay with customizable positioning.
Notas de prensa
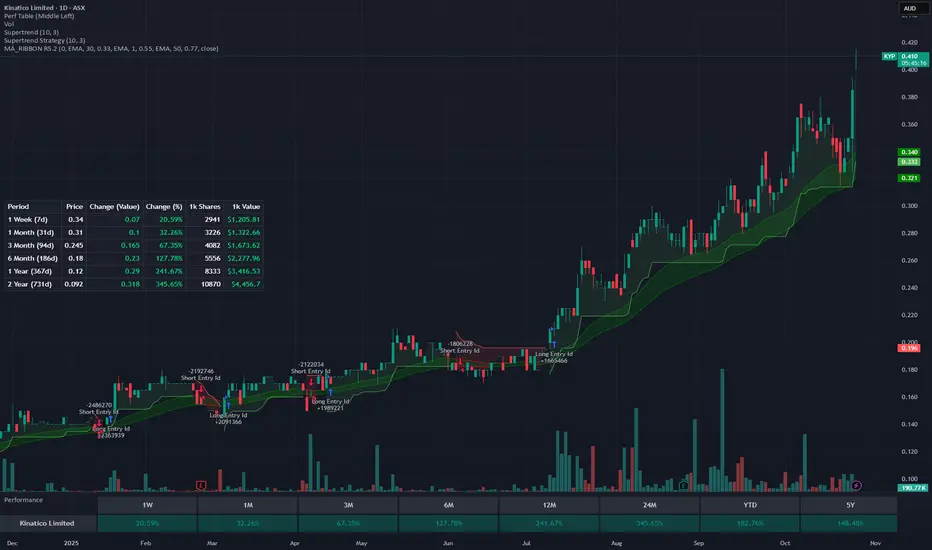
# Rolling Performance Metrics Table## Overview
A TradingView Pine Script indicator that displays a comprehensive performance metrics table showing rolling returns across multiple time periods. Uses TradingView's official **ValueAtTime library** to match their native Performance indicator calculations exactly.
## Features
- **Calendar-Based Periods**: 1 Week, 1 Month, 3 Month, 6 Month, 1 Year, 2 Year with actual day counts displayed (e.g., "1 Month (31d)")
- **Performance Metrics**:
- Starting price for each period
- Absolute change in value
- Percentage change
- Hypothetical shares purchased with $1,000
- Current value of that $1,000 investment
- **Visual Indicators**: Color-coded changes (green for gains, red for losses) with faint grid lines
- **Data Window Export**: All metrics available in TradingView's Data Window for copying
- **Customizable**: Adjustable table position and display options
## Settings
| Setting | Default | Description |
|---------|---------|-------------|
| Table Position | Middle Left | Choose from 9 positions (Top/Middle/Bottom × Left/Center/Right) |
| Show in Data Window | Enabled | Makes all data copyable from TradingView's Data Window |
## Table Columns
1. **Period** - Time period with actual calendar days (e.g., "1 Week (7d)", "1 Month (31d)")
2. **Price** - Stock price at the start of the period
3. **Change (Value)** - Absolute price change since period start
4. **Change (%)** - Percentage change since period start
5. **1k Shares** - Number of shares $1,000 would buy at period start price
6. **1k Value** - Current value of those shares at today's price
## Technical Details
### ValueAtTime Library
Uses TradingView's official `ValueAtTime` library (v2) - the same library powering their native Performance indicator:
```pine
import TradingView/ValueAtTime/2 as VAT
```
**Timeframes**: `"1W", "1M", "3M", "6M", "12M", "24M"`
The library handles complex calendar arithmetic automatically:
- Different month lengths (28-31 days)
- Leap years
- Trading days vs calendar days
- Weekend/holiday adjustments
**Day counts** are calculated from the timestamps returned by ValueAtTime, showing actual calendar days between today and the historical date for transparency.
## Version
- **Pine Script Version**: v6
- **Author**: bobmcallan@gmail.com
- **Type**: Overlay indicator
Script de código abierto
Fiel al espíritu de TradingView, el creador de este script lo ha convertido en código abierto, para que los traders puedan revisar y verificar su funcionalidad. ¡Enhorabuena al autor! Aunque puede utilizarlo de forma gratuita, recuerde que la republicación del código está sujeta a nuestras Normas internas.
Exención de responsabilidad
La información y las publicaciones no constituyen, ni deben considerarse como asesoramiento o recomendaciones financieras, de inversión, de trading o de otro tipo proporcionadas o respaldadas por TradingView. Más información en Condiciones de uso.