OPEN-SOURCE SCRIPT
辰锋
// This Pine Script® code is subject to the terms of the Mozilla Public License 2.0 at mozilla.org/MPL/2.0/
// © chenfwng88888
//version=6
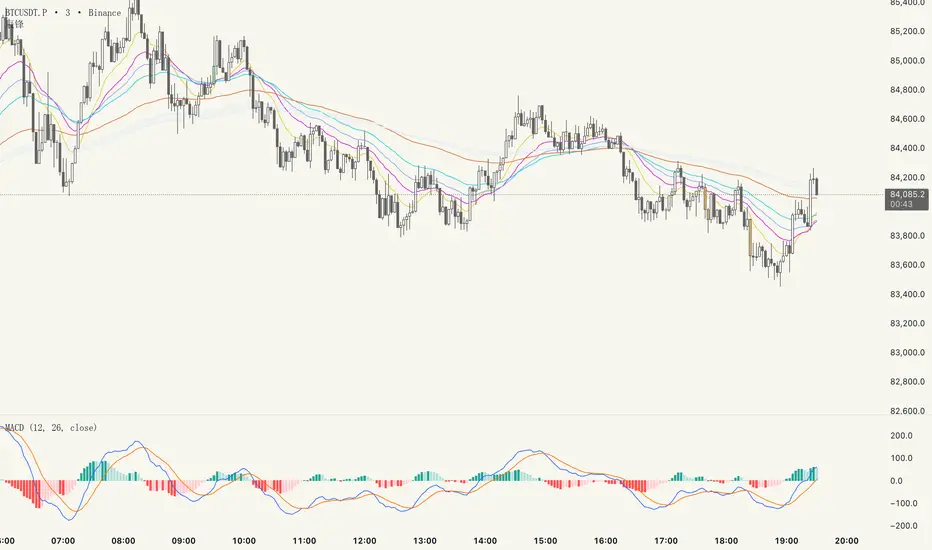
indicator("辰锋", shorttitle="辰锋", overlay=true)
// 关键EMA均线组
plot(ta.ema(close, 12), title="13", color=color.rgb(230, 202, 58), linewidth=1) // 黄色
plot(ta.ema(close, 24), title="24", color=color.rgb(208, 35, 208), linewidth=1) // 粉色
plot(ta.ema(close, 36), title="38", color=color.rgb(129, 169, 238), linewidth=1) // 墨绿
plot(ta.ema(close, 52), title="52", color=color.rgb(39, 208, 226), linewidth=1) // 蓝绿色
plot(ta.ema(close, 104), title="104", color=color.rgb(222, 109, 57), linewidth=1) // 棕色
// Vegas Channel (added EMAs)
ema144 = ta.ema(close, 144)
ema169 = ta.ema(close, 169)
plot(ema144, title="EMA 144", color=color.new(#e3ebf7, 0), linewidth=1)
plot(ema169, title="EMA 169", color=color.new(#e7e7f5, 0), linewidth=1)
// Fill between EMA 144 and EMA 169 with light blue background
fill(plot1 = plot(ema144, display=display.none),
plot2 = plot(ema169, display=display.none),
color = color.new(#deeff4, 70), title = "144-169 Area")
// Colored candles based on volume and price movement
isUp = close > open
isDown = close < open
highVolume = volume > ta.sma(volume, 50) * 3 // 50-period average + 50% threshold
// Define colors
bullishColor = color.new(#a5f1a5, 0) // Light green
bearishColor = color.new(#f2b661, 0) // Orange
// Plot candles
barcolor(isUp and highVolume ? bullishColor : isDown and highVolume ? bearishColor : na)
// © chenfwng88888
//version=6
indicator("辰锋", shorttitle="辰锋", overlay=true)
// 关键EMA均线组
plot(ta.ema(close, 12), title="13", color=color.rgb(230, 202, 58), linewidth=1) // 黄色
plot(ta.ema(close, 24), title="24", color=color.rgb(208, 35, 208), linewidth=1) // 粉色
plot(ta.ema(close, 36), title="38", color=color.rgb(129, 169, 238), linewidth=1) // 墨绿
plot(ta.ema(close, 52), title="52", color=color.rgb(39, 208, 226), linewidth=1) // 蓝绿色
plot(ta.ema(close, 104), title="104", color=color.rgb(222, 109, 57), linewidth=1) // 棕色
// Vegas Channel (added EMAs)
ema144 = ta.ema(close, 144)
ema169 = ta.ema(close, 169)
plot(ema144, title="EMA 144", color=color.new(#e3ebf7, 0), linewidth=1)
plot(ema169, title="EMA 169", color=color.new(#e7e7f5, 0), linewidth=1)
// Fill between EMA 144 and EMA 169 with light blue background
fill(plot1 = plot(ema144, display=display.none),
plot2 = plot(ema169, display=display.none),
color = color.new(#deeff4, 70), title = "144-169 Area")
// Colored candles based on volume and price movement
isUp = close > open
isDown = close < open
highVolume = volume > ta.sma(volume, 50) * 3 // 50-period average + 50% threshold
// Define colors
bullishColor = color.new(#a5f1a5, 0) // Light green
bearishColor = color.new(#f2b661, 0) // Orange
// Plot candles
barcolor(isUp and highVolume ? bullishColor : isDown and highVolume ? bearishColor : na)
Script de código abierto
Fiel al espíritu de TradingView, el creador de este script lo ha convertido en código abierto, para que los traders puedan revisar y verificar su funcionalidad. ¡Enhorabuena al autor! Aunque puede utilizarlo de forma gratuita, recuerde que la republicación del código está sujeta a nuestras Normas internas.
Exención de responsabilidad
La información y las publicaciones no constituyen, ni deben considerarse como asesoramiento o recomendaciones financieras, de inversión, de trading o de otro tipo proporcionadas o respaldadas por TradingView. Más información en Condiciones de uso.