OPEN-SOURCE SCRIPT
Actualizado Enhanced stochastic Momentum Oscillator with signals
Overall Benefits of This Enhanced SMO Script
Fully Customizable Inputs – period, smoothing type, source, and colors.
Gradient Momentum Ribbon – visually communicates strength and direction.
Overbought/Oversold Highlights – both lines and background for clarity.
Alert System Built-In – monitors crossovers and zone entries/exits.
Error-Resistant Calculations – prevents division by zero, avoids Pine v5 multi-line ternary issues.
Highly Visual – suitable for quick decision-making, not just raw numbers.
Flexible for Any Timeframe – can be used on multi-timeframe analysis.
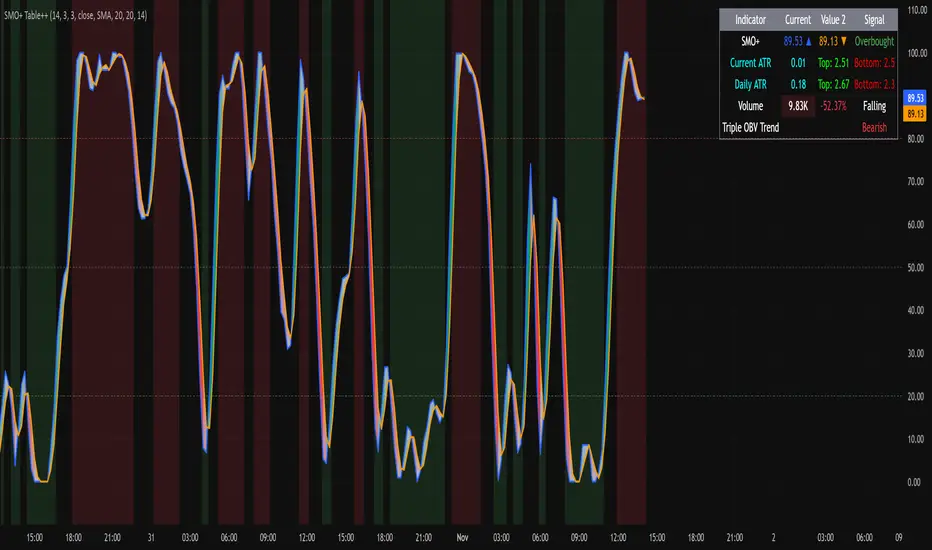
Table that shows current condition (neutral, overbought and oversold)
Try with my other indicator highlighted in picture-

Fully Customizable Inputs – period, smoothing type, source, and colors.
Gradient Momentum Ribbon – visually communicates strength and direction.
Overbought/Oversold Highlights – both lines and background for clarity.
Alert System Built-In – monitors crossovers and zone entries/exits.
Error-Resistant Calculations – prevents division by zero, avoids Pine v5 multi-line ternary issues.
Highly Visual – suitable for quick decision-making, not just raw numbers.
Flexible for Any Timeframe – can be used on multi-timeframe analysis.
Table that shows current condition (neutral, overbought and oversold)
Try with my other indicator highlighted in picture-
Notas de prensa
Update 2.0Updated to Version 6
Added volume information for direction confirmation and strength;
Volume row with spike highlighting
OBV row with % change
Triple OBV row showing Bullish/Bearish/Neutral under Status
How to implement the strategy
Identify the pattern: Look for a triple top, where an asset's price reaches approximately the same high level three times, with a low point between each peak.
Analyze volume during the peaks: Observe the On-Balance Volume (OBV) indicator during these peaks.
Bearish divergence: If the price makes a new high on the third peak, but the OBV makes a lower high, this is a bearish divergence. This indicates that even though the price is rising, the volume behind the move is decreasing, suggesting that buying pressure is weakening.
Strong trend confirmation: If the price makes a new high on the third peak and the OBV also makes a new high, it confirms the strength of the uptrend and the strategy might not be appropriate at that time.
Confirm the reversal:
If you see the bearish divergence (higher price, lower OBV on the third peak), wait for confirmation. A common confirmation is for the price to break below a support level that formed between the peaks.
The OBV line itself may also break a previous support level during this period.
Enter a short position: Once the price breaks the support level, consider entering a short position, as the triple top pattern combined with the OBV divergence suggests a reversal is likely.
Notas de prensa
Update 3.0 Added a “Sentiment” row that evaluates market bias based on:
SMO+: Overbought / Oversold
Volume: Rising / Falling / Spike
Triple OBV: Bullish / Bearish / Neutral
Simple scoring system:
Bullish sentiment if:
SMO+ is oversold (k < 20) or near midline rising
Volume is rising
Triple OBV is bullish
Bearish sentiment if:
SMO+ is overbought (k > 80) or midline falling
Volume is falling
Triple OBV is bearish
Otherwise: Neutral
Notas de prensa
Update 4.0Simplified text box to combine K and D overbought and oversold signals
Current ATR (based on chart timeframe)
Daily ATR (from 1D timeframe)
Current ATR Top / Bottom levels
Daily ATR Top / Bottom levels
Integrated into a clean expanded table layout
Notas de prensa
Minor tweaks Notas de prensa
bug fixesScript de código abierto
Siguiendo fielmente el espíritu de TradingView, el creador de este script lo ha publicado en código abierto, permitiendo que otros traders puedan revisar y verificar su funcionalidad. ¡Enhorabuena al autor! Puede utilizarlo de forma gratuita, pero tenga en cuenta que la publicación de este código está sujeta a nuestras Normas internas.
Want to join a safe community full of like-minded individuals that work together, not against each other? Join Xtrader! Link for more amazing indicators and support.
discord.gg/NHjztdYv6U
discord.gg/NHjztdYv6U
Exención de responsabilidad
La información y las publicaciones que ofrecemos, no implican ni constituyen un asesoramiento financiero, ni de inversión, trading o cualquier otro tipo de consejo o recomendación emitida o respaldada por TradingView. Puede obtener información adicional en las Condiciones de uso.
Script de código abierto
Siguiendo fielmente el espíritu de TradingView, el creador de este script lo ha publicado en código abierto, permitiendo que otros traders puedan revisar y verificar su funcionalidad. ¡Enhorabuena al autor! Puede utilizarlo de forma gratuita, pero tenga en cuenta que la publicación de este código está sujeta a nuestras Normas internas.
Want to join a safe community full of like-minded individuals that work together, not against each other? Join Xtrader! Link for more amazing indicators and support.
discord.gg/NHjztdYv6U
discord.gg/NHjztdYv6U
Exención de responsabilidad
La información y las publicaciones que ofrecemos, no implican ni constituyen un asesoramiento financiero, ni de inversión, trading o cualquier otro tipo de consejo o recomendación emitida o respaldada por TradingView. Puede obtener información adicional en las Condiciones de uso.