PROTECTED SOURCE SCRIPT
Actualizado SADX+DI - Smoothed Average Directional Index by CrypTaux
This script is based on ADX/DI and I use it to enter when trend is in early stage, then ride it & exit at the right time (that's the theory)
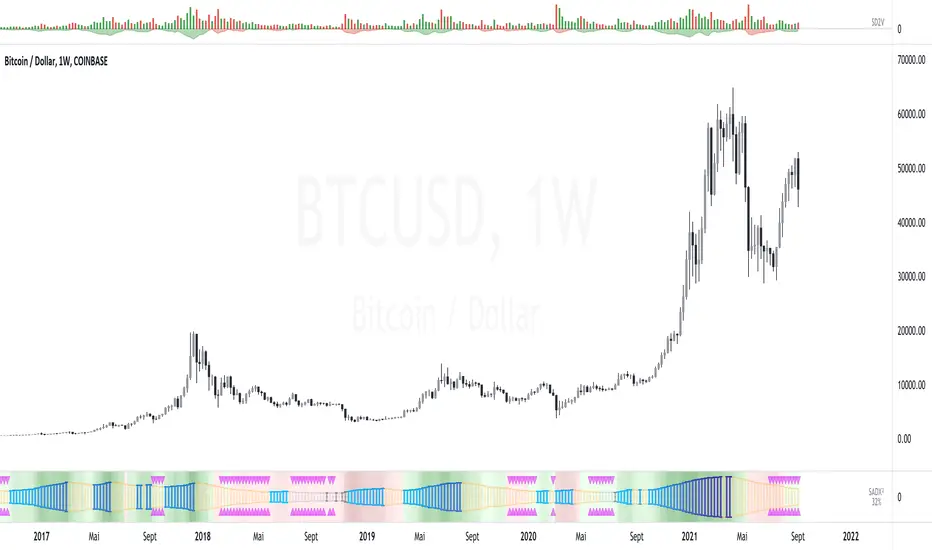
ADX is shown as histogram :
- light silver bars = price is under thresold but still no trend, be patient.
- strong gray bars = prepare to enter the trade soon
- blue bars = price momentum so ride the trend
- yellow bars = do not trade (price reverts or consolidates)
Background color/bottom area based on DI+/DI- :
- green = uptrend
- red = downtrend
Top pink triangles appears when ADX is relatively low based on "lookback" history (not based on previous static threshold) so a new trend may happens so stay alerts.
- Prepare for enter when bars turn dark gray and/or pink triangles appears.
- Enter position as soon as you see blue bar (Long or Short as indicated by the area color)
- and Exit on first yellow bar.
Quite simple, works on multiple HTF/LTF and might be used with graphical analysis to find best opportunities.
Enjoy :)
--
Version 35.
Notas de prensa
SADX V2 :- Updated SADX bars visualization (mirror mode),
- Set Background color to reflect uptrend (green) or downtrend (red) period,
- [OPTIONAL] Added BBW (Bollinger Bands Width) lines and Squeeze indicator that may complete SADX extensions/compressions/squeeze periods,
- [OPTIONAL] Added ATR (Average True Range) Squeeze indicator (squares) that very often precedes a relative bigger candle or move.
Notas de prensa
Cosmetic fix : updated TradingView graph to show Price and SADX indicator only.Script protegido
Este script se publica como código cerrado. No obstante, puede utilizarlo libremente y sin ninguna limitación. Obtenga más información aquí.
All my stuff @ go2.st/CTH
BTC : bc1qlufls5at2706s53y4naqnm9q58jjaj3nk4cm4w
Disclaimer : No financial advice. Ideas & scripts are for educational purpose only, always do your own research.
BTC : bc1qlufls5at2706s53y4naqnm9q58jjaj3nk4cm4w
Disclaimer : No financial advice. Ideas & scripts are for educational purpose only, always do your own research.
Exención de responsabilidad
La información y las publicaciones no constituyen, ni deben considerarse como asesoramiento o recomendaciones financieras, de inversión, de trading o de otro tipo proporcionadas o respaldadas por TradingView. Más información en Condiciones de uso.
Script protegido
Este script se publica como código cerrado. No obstante, puede utilizarlo libremente y sin ninguna limitación. Obtenga más información aquí.
All my stuff @ go2.st/CTH
BTC : bc1qlufls5at2706s53y4naqnm9q58jjaj3nk4cm4w
Disclaimer : No financial advice. Ideas & scripts are for educational purpose only, always do your own research.
BTC : bc1qlufls5at2706s53y4naqnm9q58jjaj3nk4cm4w
Disclaimer : No financial advice. Ideas & scripts are for educational purpose only, always do your own research.
Exención de responsabilidad
La información y las publicaciones no constituyen, ni deben considerarse como asesoramiento o recomendaciones financieras, de inversión, de trading o de otro tipo proporcionadas o respaldadas por TradingView. Más información en Condiciones de uso.