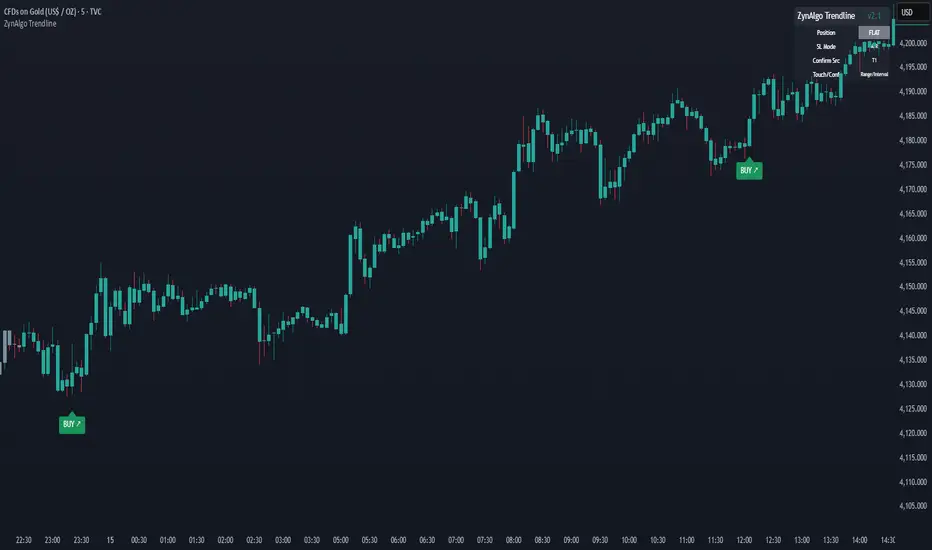
ZynAlgo Trendline
It is designed to help traders objectively understand market structure, directional bias, and momentum strength — without relying on guesswork or manual chart marking.
The system uses adaptive moving-average logic and multi-timeframe validation to highlight when trend conditions align, when momentum is fading, and when price action enters consolidation.
All calculations are performed internally to maintain a clean, responsive display suitable for both discretionary and rule-based traders.
⚙️ CORE CONCEPT
Markets tend to alternate between trending and ranging phases.
ZynAlgo Trendline provides clarity by analyzing three independent components:
Baseline Trend Filter — establishes the primary market direction.
Confirmation Layers — evaluate shorter-term movements and verify whether momentum agrees with the baseline.
Slope & Separation Logic — filters out weak or conflicting conditions to help reduce false signals in sideways markets.
When all selected layers align, the dashboard and candles adapt visually to reflect a consistent directional bias, helping traders act with greater confidence and discipline.
🧩 FEATURES OVERVIEW
Multi-Timeframe Confluence Scanner: checks up to eight higher-timeframe signals to confirm trend alignment.
Adaptive Slope Filters: dynamically adjust sensitivity based on price movement percentage or ATR percentage.
Customizable Baseline: choose from EMA, SMA, RMA, WMA, or ALMA for your preferred trend foundation.
Dynamic Candle Coloring: automatically reflects bullish, bearish, or neutral market states.
Structured TP/SL Zones: optional visualization of stop-loss and take-profit targets based on predefined ratios.
Trend Strength Dashboard: compact panel showing confluence count, slope value, and bias confirmation.
Session & Day Filters: limit activity display to specific trading sessions or weekdays.
Signal Cooldown Mode: controls signal frequency and reduces chart clutter.
Smart Alert Integration: alert conditions for trend shifts, baseline crosses, and confirmation changes.
Each feature can be toggled or customized directly from the indicator’s settings panel, allowing for both simple and advanced use.
🧠 HOW TO USE
Add the indicator to any chart and ensure the chosen timeframe matches your trading approach.
Select your baseline length (e.g., 200-period EMA for long-term structure, 50-period for short-term).
Enable multi-timeframe confluence to confirm whether higher-timeframe trends agree with your chart.
Adjust slope sensitivity to avoid signals in flat or ranging markets.
Monitor the dashboard:
Green values = bullish alignment
Red values = bearish alignment
Gray = neutral or conflicting trend data
Optionally enable TP/SL visualization to understand current R:R zones relative to your entry concept.
Use alerts or visual color shifts as confirmation — not as standalone entry signals.
The system is designed to complement any technical analysis style, supporting both trend-following and mean-reversion frameworks.
📊 INTERPRETATION GUIDE
Visual Element Meaning
🟢 Green Candles Confirmed uptrend based on baseline + confirmation layers
🔴 Red Candles Confirmed downtrend alignment
⚫ Gray Candles Neutral / range conditions
🟩 Green Dashboard High confluence across multiple timeframes
🟥 Red Dashboard Downtrend alignment across multiple timeframes
⬛ Gray Dashboard Mixed or conflicting trend data
⚠️ Label or Alert Trend change, new confirmation, or structure reset
This unified view helps traders quickly identify trend direction, evaluate trade continuation potential, and anticipate when structure may shift.
⚙️ CUSTOMIZATION OPTIONS
Baseline Length & Type: define your long-term trend filter.
Slope Mode: choose between Price%, ATR%, or Angle for precision control.
Confluence Count: set how many timeframes must agree before a trend is confirmed.
Entry Confirmation Source: select between Type 1 / Type 2 short-term confirmation logic.
Cool-Down Period: prevent overlapping or clustered signals.
Label Control: toggle BUY/SELL text visibility, offsets, and color contrast.
Dashboard Layout: reposition or resize the display for different chart setups.
Each trader can adapt these inputs according to volatility, market type (forex, crypto, indices), and personal risk tolerance.
💡 BEST PRACTICES
Use ZynAlgo Trendline™ as a trend confirmation and management tool — not as a stand-alone entry generator.
Combine it with your preferred support/resistance zones, order-flow indicators, or volume tools for deeper context.
Avoid taking trades against the long-term baseline direction unless a clear structure shift is confirmed.
Regularly review performance across multiple pairs or instruments to determine optimal parameter combinations.
Keep chart visuals minimal by disabling layers you are not actively using.
🔶 CONCLUSION
We believe that success lies in the association of the user with the indicator, opposed to many traders who have the perspective that the indicator itself can make them become profitable. The reality is much more complicated than that. The aim is to provide an indicator comprehensive, customizable, and intuitive enough that any trader can be led to understand this truth and develop an actionable perspective of technical indicators as support tools for decision making. You can see the Author's instructions below to get instant access to this indicator
🔶 RISK DISCLAIMER
Trading is risky & most day traders lose money. All content, tools, scripts, articles, & education provided by ZynAlgo are purely for informational & educational purposes only. Past performance does not guarantee future results.
Script que requiere invitación
Solo los usuarios autorizados por el autor pueden acceder a este script. Tendrá que solicitar y obtener permiso para utilizarlo. Normalmente se concede previo pago. Para obtener más información, siga las instrucciones del autor o póngase en contacto directamente con ZynAlgo.
TradingView NO recomienda pagar o utilizar un script a menos que confíe plenamente en su autor y entienda cómo funciona. También puede encontrar alternativas gratuitas de código abierto en nuestros scripts de la comunidad.
Instrucciones del autor
Exención de responsabilidad
Script que requiere invitación
Solo los usuarios autorizados por el autor pueden acceder a este script. Tendrá que solicitar y obtener permiso para utilizarlo. Normalmente se concede previo pago. Para obtener más información, siga las instrucciones del autor o póngase en contacto directamente con ZynAlgo.
TradingView NO recomienda pagar o utilizar un script a menos que confíe plenamente en su autor y entienda cómo funciona. También puede encontrar alternativas gratuitas de código abierto en nuestros scripts de la comunidad.