OPEN-SOURCE SCRIPT
Actualizado Gaussian Ribbon
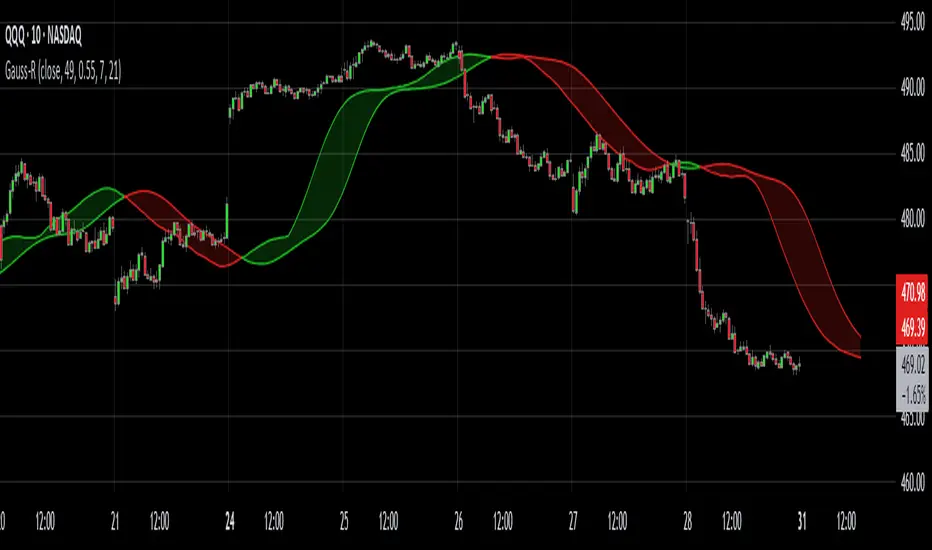
The Gaussian Ribbon utilizes two "Arnaud Legoux" moving averages with the same length to identify changes in trend direction. The plotted channel consists of two lines, one based on the default offset and sigma values, and the other with slightly adjusted customizable parameters.
In summary, the Gaussian Ribbon uses the offset and power of the second ALMA to create a lag that still calculates using the same length.
- ALMA is a type of moving average that is related to the Gaussian function through its mathematical formula and the concept of weighted averages.
- The ALMA is designed to reduce lag in moving averages and provide more timely responses to price changes. It achieves this by applying a Gaussian distribution (bell-shaped curve) as a weighting function to the price data.
- The Gaussian function is used to calculate the weights in the ALMA formula. These weights give more importance to recent price data while gradually reducing the influence of older data points. This results in a smoother and more responsive moving average.
In summary, the Gaussian Ribbon uses the offset and power of the second ALMA to create a lag that still calculates using the same length.
Notas de prensa
Updated default parameters due to a style setting issue, you can change the default colors and transparency from the pine editor for the time beingNotas de prensa
- Minor script reorganization and V6 update
Notas de prensa
- Addition of lag input, works much like the kumo cloud, highlighting areas of support and resistance.
Script de código abierto
Fiel al espíritu de TradingView, el creador de este script lo ha convertido en código abierto, para que los traders puedan revisar y verificar su funcionalidad. ¡Enhorabuena al autor! Aunque puede utilizarlo de forma gratuita, recuerde que la republicación del código está sujeta a nuestras Normas internas.
KP
Exención de responsabilidad
La información y las publicaciones no constituyen, ni deben considerarse como asesoramiento o recomendaciones financieras, de inversión, de trading o de otro tipo proporcionadas o respaldadas por TradingView. Más información en Condiciones de uso.