OPEN-SOURCE SCRIPT
Actualizado Guppy Wave [UkutaLabs]
█ OVERVIEW
The Guppy Wave Indicator is a collection of Moving Averages that provide insight on current market strength. This is done by plotting a series of 12 Moving Averages and analysing where each one is positioned relative to the others.
In doing this, this script is able to identify short-term moves and give an idea of the current strength and direction of the market.
The aim of this script is to simplify the trading experience of users by automatically displaying a series of useful Moving Averages to provide insight into short-term market strength.
█ USAGE
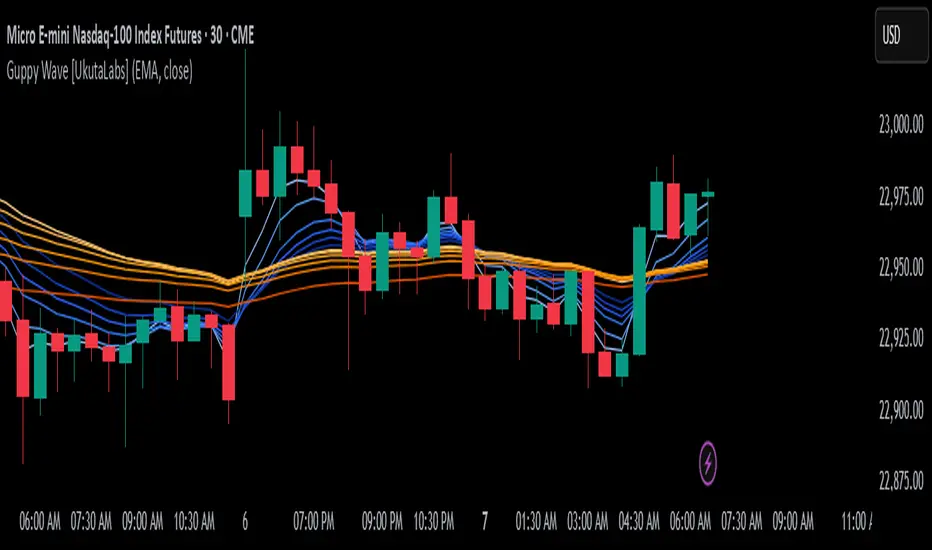
The Guppy Wave is generated using a series of 12 total Moving Averages composed of 6 Small-Period Moving Averages and 6 Large Period Moving Averages. By measuring the position of each moving average relative to the others, this script provides unique insight into the current strength of the market.
Rather than simply plotting 12 Moving Averages, a color gradient is instead drawn between the Moving Averages to make it easier to visualise the distribution of the Guppy Wave. The color of this gradient changes depending on whether the Small-Period Averages are above or below the Large-Period Averages, allowing traders to see current short-term market strength at a glance.
When the gradient fans out, this indicates a rapid short-term move. When the gradient is thin, this indicates that there is no dominant power in the market.
█ SETTINGS
• Moving Average Type: Determines the type of Moving Average that get plotted (EMA, SMA, WMA, VWMA, HMA, RMA)
• Moving Average Source: Determines the source price used to calculate Moving Averages (open, high, low, close, hl2, hlc3, ohlc4, hlcc4)
• Bearish Color: Determines the color of the gradient when Small-Period MAs are above Large-Period MAs.
• Bullish Color: Determines the color of the gradient when Small-Period MAs are below Large-Period MAs.
The Guppy Wave Indicator is a collection of Moving Averages that provide insight on current market strength. This is done by plotting a series of 12 Moving Averages and analysing where each one is positioned relative to the others.
In doing this, this script is able to identify short-term moves and give an idea of the current strength and direction of the market.
The aim of this script is to simplify the trading experience of users by automatically displaying a series of useful Moving Averages to provide insight into short-term market strength.
█ USAGE
The Guppy Wave is generated using a series of 12 total Moving Averages composed of 6 Small-Period Moving Averages and 6 Large Period Moving Averages. By measuring the position of each moving average relative to the others, this script provides unique insight into the current strength of the market.
Rather than simply plotting 12 Moving Averages, a color gradient is instead drawn between the Moving Averages to make it easier to visualise the distribution of the Guppy Wave. The color of this gradient changes depending on whether the Small-Period Averages are above or below the Large-Period Averages, allowing traders to see current short-term market strength at a glance.
When the gradient fans out, this indicates a rapid short-term move. When the gradient is thin, this indicates that there is no dominant power in the market.
█ SETTINGS
• Moving Average Type: Determines the type of Moving Average that get plotted (EMA, SMA, WMA, VWMA, HMA, RMA)
• Moving Average Source: Determines the source price used to calculate Moving Averages (open, high, low, close, hl2, hlc3, ohlc4, hlcc4)
• Bearish Color: Determines the color of the gradient when Small-Period MAs are above Large-Period MAs.
• Bullish Color: Determines the color of the gradient when Small-Period MAs are below Large-Period MAs.
Notas de prensa
Added ability to turn off 'EMA Fill' so it will display individual EMA linesScript de código abierto
Fiel al espíritu de TradingView, el creador de este script lo ha convertido en código abierto, para que los traders puedan revisar y verificar su funcionalidad. ¡Enhorabuena al autor! Aunque puede utilizarlo de forma gratuita, recuerde que la republicación del código está sujeta a nuestras Normas internas.
Exención de responsabilidad
La información y las publicaciones no constituyen, ni deben considerarse como asesoramiento o recomendaciones financieras, de inversión, de trading o de otro tipo proporcionadas o respaldadas por TradingView. Más información en Condiciones de uso.
Script de código abierto
Fiel al espíritu de TradingView, el creador de este script lo ha convertido en código abierto, para que los traders puedan revisar y verificar su funcionalidad. ¡Enhorabuena al autor! Aunque puede utilizarlo de forma gratuita, recuerde que la republicación del código está sujeta a nuestras Normas internas.
Exención de responsabilidad
La información y las publicaciones no constituyen, ni deben considerarse como asesoramiento o recomendaciones financieras, de inversión, de trading o de otro tipo proporcionadas o respaldadas por TradingView. Más información en Condiciones de uso.