PROTECTED SOURCE SCRIPT
DWP_Fabric_of_Time
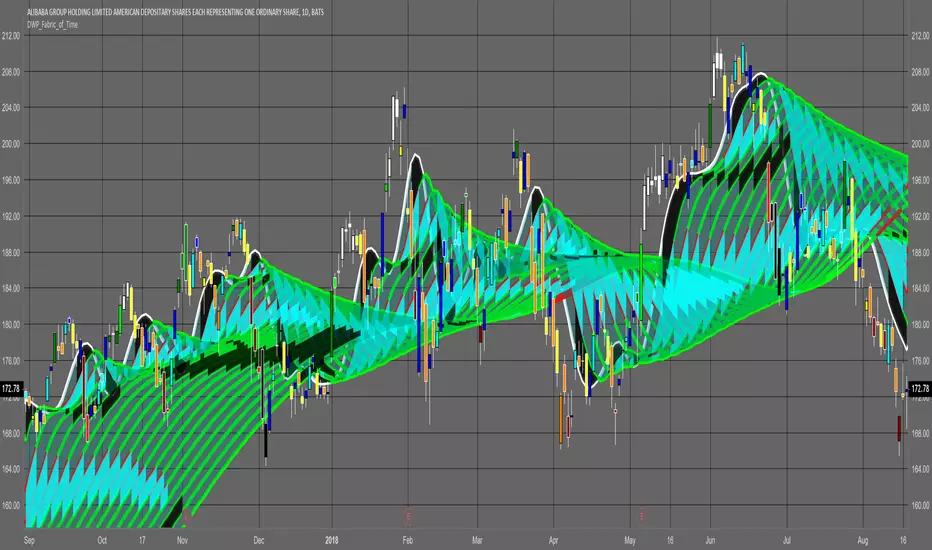
Hello, The following is an indicator I wrote that shows the resistance or support created by the contraction or expansion of moving averages of price over time. The theory is that the areas created by either the decline or acceleration of sma lines are caused by either fear or excitement in the market thus marking the area for future support or resistance to take place. The light blue blocks indicate a decrease in expansion till no expansion. The dark black blocks indicate a decrease in contraction till no contraction. Both blocks can be support or resistance. Once a block is breached look for a reversal. if the block is penetrated over half-way then it will usually continue to the other side before reversing. Their is a multiplier in the script to allow expansion of the indicator. I have also added a bar color indicator for the strength of the move. This can be turned on or off in settings. The colors are paired up as such.
Up = aqua, blue,green, lime,white. | Down = yellow, orange,maroon, red,black.
Hope this helps visualize the market.
Good Trading MoveTrap

Up = aqua, blue,green, lime,white. | Down = yellow, orange,maroon, red,black.
Hope this helps visualize the market.
Good Trading MoveTrap
Script protegido
Este script se publica como código cerrado. No obstante, puede utilizarlo libremente y sin ninguna limitación. Obtenga más información aquí.
Exención de responsabilidad
La información y las publicaciones no constituyen, ni deben considerarse como asesoramiento o recomendaciones financieras, de inversión, de trading o de otro tipo proporcionadas o respaldadas por TradingView. Más información en Condiciones de uso.