OPEN-SOURCE SCRIPT
ANIL's OHCL, VWAP and EMA Cross
Previous Week High and Low:
This part calculates the previous week's high and low values and plots them as continuous blue lines. The plot.style_line ensures the lines are drawn continuously.
Previous Day Open, High, Low, Close:
The script uses request.security to get the previous day's open, high, low, and close values. These are plotted as continuous lines in different colors:
Open: Green
High: Red
Low: Orange
Close: Purple
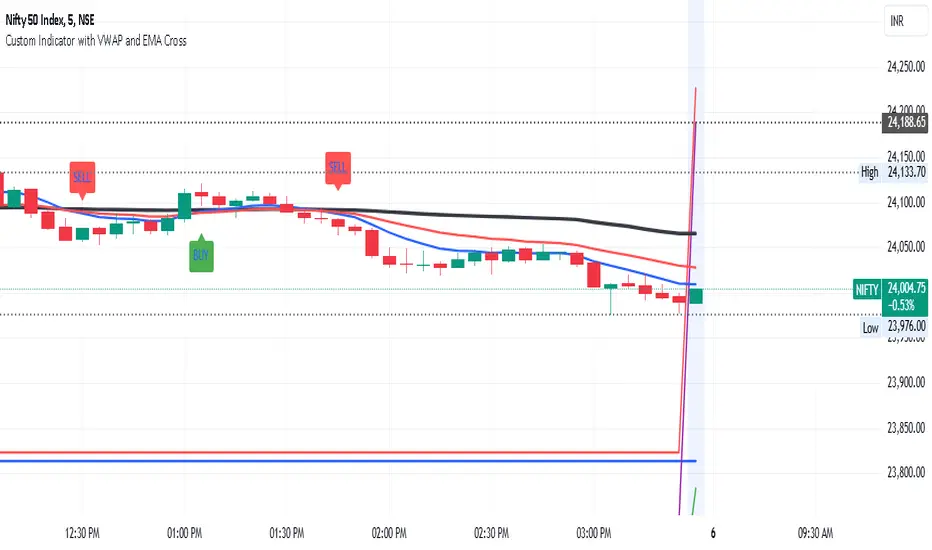
VWAP (Volume Weighted Average Price):
The VWAP is calculated using ta.vwap(close) and plotted with a thick black line.
Exponential Moving Averages (EMAs):
The script calculates two EMAs: one with a 9-period (fast) and one with a 21-period (slow).
The EMAs are plotted as continuous lines:
Fast EMA: Blue
Slow EMA: Red
EMA Cross:
The script checks for EMA crossovers and crossunders:
A crossover (fast EMA crossing above slow EMA) triggers a buy signal (green label below the bar).
A crossunder (fast EMA crossing below slow EMA) triggers a sell signal (red label above the bar).
Customization:
You can adjust the fastLength and slowLength variables to change the period of the EMAs.
You can modify the line colors and line thickness to match your preferred style.
The buy and sell signals can be customized further with different shapes or additional conditions for signal generation.
This script provides a comprehensive and visually distinct indicator with the previous week's and day's levels, VWAP, and EMA crossover signals.
This part calculates the previous week's high and low values and plots them as continuous blue lines. The plot.style_line ensures the lines are drawn continuously.
Previous Day Open, High, Low, Close:
The script uses request.security to get the previous day's open, high, low, and close values. These are plotted as continuous lines in different colors:
Open: Green
High: Red
Low: Orange
Close: Purple
VWAP (Volume Weighted Average Price):
The VWAP is calculated using ta.vwap(close) and plotted with a thick black line.
Exponential Moving Averages (EMAs):
The script calculates two EMAs: one with a 9-period (fast) and one with a 21-period (slow).
The EMAs are plotted as continuous lines:
Fast EMA: Blue
Slow EMA: Red
EMA Cross:
The script checks for EMA crossovers and crossunders:
A crossover (fast EMA crossing above slow EMA) triggers a buy signal (green label below the bar).
A crossunder (fast EMA crossing below slow EMA) triggers a sell signal (red label above the bar).
Customization:
You can adjust the fastLength and slowLength variables to change the period of the EMAs.
You can modify the line colors and line thickness to match your preferred style.
The buy and sell signals can be customized further with different shapes or additional conditions for signal generation.
This script provides a comprehensive and visually distinct indicator with the previous week's and day's levels, VWAP, and EMA crossover signals.
Script de código abierto
Fiel al espíritu de TradingView, el creador de este script lo ha convertido en código abierto, para que los traders puedan revisar y verificar su funcionalidad. ¡Enhorabuena al autor! Aunque puede utilizarlo de forma gratuita, recuerde que la republicación del código está sujeta a nuestras Normas internas.
Exención de responsabilidad
La información y las publicaciones no constituyen, ni deben considerarse como asesoramiento o recomendaciones financieras, de inversión, de trading o de otro tipo proporcionadas o respaldadas por TradingView. Más información en Condiciones de uso.