OPEN-SOURCE SCRIPT
Actualizado Multi-Timeframe Stoch RSI Dashboard
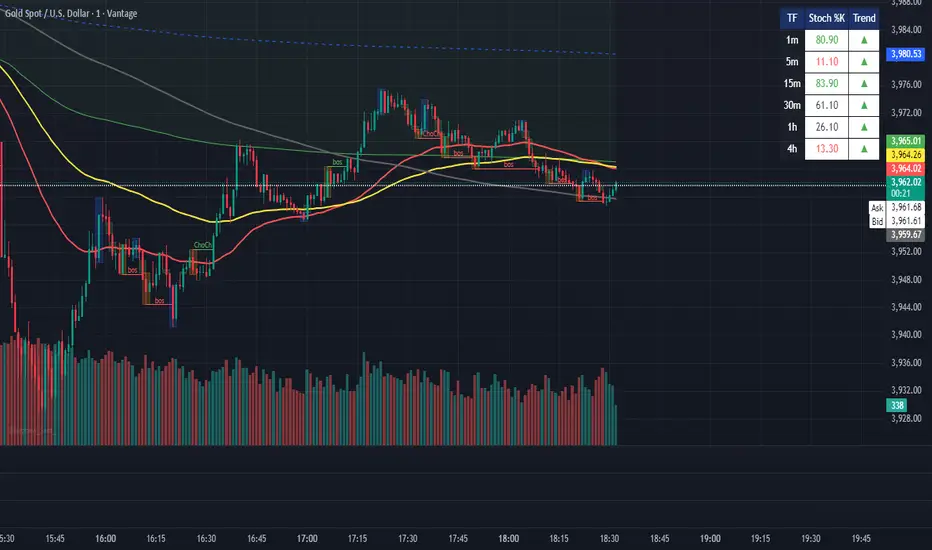
Shows the Stoch RSI values for different timeframes in a box on the top right corner.
1m
5m
15m
30m
1h
4h
Above 80 = green
Below 20 = red
Black = between 20 and 80.
1m
5m
15m
30m
1h
4h
Above 80 = green
Below 20 = red
Black = between 20 and 80.
Notas de prensa
Version 2 where values are correct when switching timeframes.Notas de prensa
Added trend arrows to show the direction of the trend of the Stoch RSI.Script de código abierto
Siguiendo fielmente el espíritu de TradingView, el creador de este script lo ha publicado en código abierto, permitiendo que otros traders puedan revisar y verificar su funcionalidad. ¡Enhorabuena al autor! Puede utilizarlo de forma gratuita, pero tenga en cuenta que la publicación de este código está sujeta a nuestras Normas internas.
Exención de responsabilidad
La información y las publicaciones que ofrecemos, no implican ni constituyen un asesoramiento financiero, ni de inversión, trading o cualquier otro tipo de consejo o recomendación emitida o respaldada por TradingView. Puede obtener información adicional en las Condiciones de uso.
Script de código abierto
Siguiendo fielmente el espíritu de TradingView, el creador de este script lo ha publicado en código abierto, permitiendo que otros traders puedan revisar y verificar su funcionalidad. ¡Enhorabuena al autor! Puede utilizarlo de forma gratuita, pero tenga en cuenta que la publicación de este código está sujeta a nuestras Normas internas.
Exención de responsabilidad
La información y las publicaciones que ofrecemos, no implican ni constituyen un asesoramiento financiero, ni de inversión, trading o cualquier otro tipo de consejo o recomendación emitida o respaldada por TradingView. Puede obtener información adicional en las Condiciones de uso.