RicardoSantos

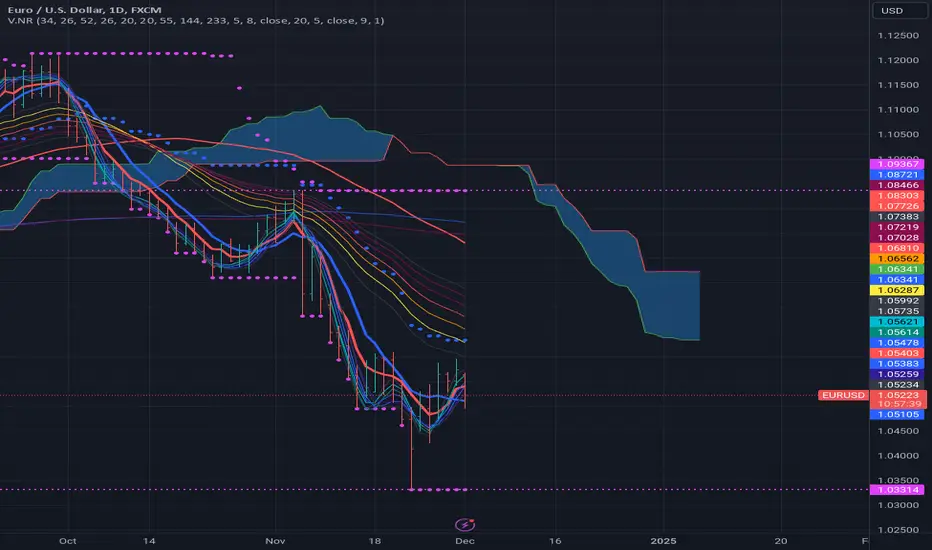
[RS]vdub Nexus Ribbon V0

Request for vdubus.
Script de código abierto

Siguiendo el verdadero espíritu de TradingView, el autor de este script lo ha publicado en código abierto, para que los traders puedan entenderlo y verificarlo. ¡Un hurra por el autor! Puede utilizarlo de forma gratuita, aunque si vuelve a utilizar este código en una publicación, debe cumplir con lo establecido en las Normas internas. Puede añadir este script a sus favoritos y usarlo en un gráfico.

Exención de responsabilidad

La información y las publicaciones que ofrecemos, no implican ni constituyen un asesoramiento financiero, ni de inversión, trading o cualquier otro tipo de consejo o recomendación emitida o respaldada por TradingView. Puede obtener información adicional en las Condiciones de uso.

¿Quiere utilizar este script en un gráfico?
//Script editor vdubus coded by RicardoSantos
// (set variables as required Upper & Lower) Switch out any of the indicators you don't want.
study(title="[RS]vdub Nexus Ribbon V0", shorttitle="[RS]vdub Nexus Ribbon V0", overlay=true)
 
//============================Ichomku cloud
//- if possible just the cloud it self & conversion period
show_cloud = input(true, title="Display Ichimoku Cloud:")
conversionPeriods = input(34, minval=1)
basePeriods = input(26, minval=1)
laggingSpan2Periods = input(52, minval=1)
displacement = input(26, minval=1)

donchian(len) => avg(lowest(len), highest(len))

conversionLine = donchian(conversionPeriods)
baseLine = donchian(basePeriods)
leadLine1 = avg(conversionLine, baseLine)
leadLine2 = donchian(laggingSpan2Periods)

plot(not show_cloud ? na : conversionLine, color=blue,linewidth=2, style=circles, title="Mid line resistance levels")
//plot(baseLine, color=red, title="Base Line")
//plot(close, offset = -displacement, color=green, title="Lagging Span")

p1 = plot(not show_cloud ? na : leadLine1, offset = displacement, color=green, title="Lead 1")
p2 = plot(not show_cloud ? na : leadLine2, offset = displacement, color=red, title="Lead 2")
fill(p1, p2)

//===============================Pivot channel==========================
length1 = input(20, minval=1, title="Upper Channel")
length2 = input(20, minval=1, title="Lower Channel")
 
upper = highest(length1)
lower = lowest(length2)
basis = avg(upper, lower)
 
l = plot(lower, style=circles, linewidth=2, color=fuchsia, title="lower")
u = plot(upper, style=circles, linewidth=2, color=fuchsia, title="upper")
//======================================================================
 
//-----------------Built in MA 55-----------------------------------------
m1_src = close
m1_p = input(55, title="MA1 Period:")
 
plot(sma(m1_src, m1_p), color=red, linewidth=2, title="MA1")
 
//-----------------Built in MA 144-----------------------------------------
m2_src = close
m2_p = input(144, title="MA2 Period:")
 
plot(sma(m2_src, m2_p), color=blue, linewidth=1, title="MA2")
 
//-----------------Built in MA 233-----------------------------------------
m3_src = close
m3_p = input(233, title="MA3 Period:")
 
plot(sma(m3_src, m3_p), color=maroon, linewidth=1, title="MA3")
 
//--------------------Strength indicators MA------------------
m4_src = close
m4_p = input(5, title="Strength indicator MA4:")
 
plot(sma(m4_src, m4_p), color=red, linewidth=3, title="Strength indicator MA4")
 
m5_src = close
m5_p = input(8, title="Strength indicator MA5:")
 
plot(sma(m5_src, m5_p), color=blue, linewidth=3, title="Strength indicator MA5")
//============= TV's MA EXP RIBBON =====================
//  Exp MA's Set Inputs:
show_ema = input(true, title="Display Exponential MA Set:")
ema_src = input(close, title="Exponential MA's Source:")
ema_base_length = input(20, minval=1, title="Exponential MA's Base Length:")
ema_length_scalar = input(5, minval=0, title="Exponential MA's Length Scalar:")
//=============Exp MA 9..15==============================
plot(not show_ema ? na : ema(ema_src, ema_base_length)                    , color=black, linewidth=1, title="Exponential MA 1:")
plot(not show_ema ? na : ema(ema_src, ema_base_length+ema_length_scalar)  , color=yellow, linewidth=1, title="Exponential MA 2:")
plot(not show_ema ? na : ema(ema_src, ema_base_length+ema_length_scalar*2), color=orange, linewidth=1, title="Exponential MA 3:")
plot(not show_ema ? na : ema(ema_src, ema_base_length+ema_length_scalar*3), color=red, linewidth=1, title="Exponential MA 4:")
plot(not show_ema ? na : ema(ema_src, ema_base_length+ema_length_scalar*4), color=maroon, linewidth=1, title="Exponential MA 5:")
plot(not show_ema ? na : ema(ema_src, ema_base_length+ema_length_scalar*5), color=maroon, linewidth=1, title="Exponential MA 6:")
plot(not show_ema ? na : ema(ema_src, ema_base_length+ema_length_scalar*6), color=black, linewidth=1, title="Exponential MA 7:")
//===============================================

//===============================================
 
//=============Hull MA's 9 - 15
//  Hull MA's Set Inputs:
show_hma = input(true, title="Display Hull MA Set:")
hma_src = input(close, title="Hull MA's Source:")
hma_base_length = input(9, minval=1, title="Hull MA's Base Length:")
hma_length_scalar = input(1, minval=0, title="Hull MA's Length Scalar:")
//  Hull MA Function:
hullma(src, length)=>wma(2*wma(src, length/2)-wma(src, length), round(sqrt(length)))
//=============Hull MA 9..15==============================
plot(not show_hma ? na : hullma(hma_src, hma_base_length)                    , color=black, linewidth=1, title="Hull MA 1:")
plot(not show_hma ? na : hullma(hma_src, hma_base_length+hma_length_scalar)  , color=aqua, linewidth=1, title="Hull MA 2:")
plot(not show_hma ? na : hullma(hma_src, hma_base_length+hma_length_scalar*2), color=teal, linewidth=1, title="Hull MA 3:")
plot(not show_hma ? na : hullma(hma_src, hma_base_length+hma_length_scalar*3), color=blue, linewidth=1, title="Hull MA 4:")
plot(not show_hma ? na : hullma(hma_src, hma_base_length+hma_length_scalar*4), color=blue, linewidth=1, title="Hull MA 5:")
plot(not show_hma ? na : hullma(hma_src, hma_base_length+hma_length_scalar*5), color=navy, linewidth=1, title="Hull MA 6:")
plot(not show_hma ? na : hullma(hma_src, hma_base_length+hma_length_scalar*6), color=black, linewidth=1, title="Hull MA 7:")
//===============================================