pta_plot
pta_plot: This library will help you to plot different value. I will keep updating with your requirement
print_array(array_id, border_color)
Display array element as a table.
Parameters:
array_id: Id of your array.
border_color: Color for border (`color.black` is used if no argument is supplied).
Returns: Display array element in bottom of the pane.
Added:
print_array_float(array_id, border_color)
Display array element as a table.
Parameters:
array_id: Id of your array.
border_color: Color for border (`color.black` is used if no argument is supplied).
Returns: Display array element in bottom of the pane.
print_array_int(array_id, border_color)
Display array element as a table.
Parameters:
array_id: Id of your array.
border_color: Color for border (`color.black` is used if no argument is supplied).
Returns: Display array element in bottom of the pane.
Removed:
print_array(array_id, border_color)
Display array element as a table.
Added:
print_array_string(array_id, border_color)
Display array element as a table.
Parameters:
array_id: Id of your array.
border_color: Color for border (`color.black` is used if no argument is supplied).
Returns: Display array element in bottom of the pane.
Added:
print_array_bool(array_id, border_color)
Display array element as a table.
Parameters:
array_id: Id of your array.
border_color: Color for border (`color.black` is used if no argument is supplied).
Returns: Display array element in bottom of the pane.
Added:
peakprofit(longcondition, shortcondition)
peakprofit: This function will create a label for max profit in trade range.
Parameters:
longcondition: is a Boolean Value
shortcondition: is a Boolean Value
Returns: peakprofit Create Label on Chart
Instruction: Don't forget to add max_labels_count=500, max_bars_back=500
Updated:
print_array_float(array_id, position, border_color)
Display array element as a table.
Parameters:
array_id: Id of your array.
position
border_color: Color for border (`color.black` is used if no argument is supplied).
Returns: Display array element in bottom of the pane.
print_array_int(array_id, position, border_color)
Display array element as a table.
Parameters:
array_id: Id of your array.
position: Position of Table
border_color: Color for border (`color.black` is used if no argument is supplied).
Returns: Display array element in bottom of the pane.
print_array_string(array_id, position, border_color)
Display array element as a table.
Parameters:
array_id: Id of your array.
position: Position of Table
border_color: Color for border (`color.black` is used if no argument is supplied).
Returns: Display array element in bottom of the pane.
print_array_bool(array_id, position, border_color)
Display array element as a table.
Parameters:
array_id: Id of your array.
position: Position of Table
border_color: Color for border (`color.black` is used if no argument is supplied).
Returns: Display array element in bottom of the pane.
Removed:
peakprofit(longcondition, shortcondition)
peakprofit: This function will create a label for max profit in trade range.
Added:
calcCPR(High, Low, Close)
Return CPR.
Parameters:
High (float)
Low (float)
Close (float)
Returns: CPR Value as Tuple [pp, tc, bc, r1, r2, r3, r4, s1, s2, s3, s4].
- `dll` function:
- Function's purpose : Plot a horizontal line and label at a specified price level on the chart.
- Parameters:
- Price (float): The Y value for the line and label.
- Text (string): The text to display alongside the label.
- Color (color): The color for the line and label text.
- Width (int, default=1): The width of the line.
- LineStyle (string, default=line.style_solid): The style of the line.
- Historical (bool, default=false): If true, the line and label will appear on historical chart data.
- Returns: Displays a horizontal line and label on the chart.
- Motive: Enhances readability and usability by providing a function for plotting customizable lines and labels on charts.
- `dll` function updated:
- Function's purpose : Plot a horizontal line and label at a specified price level on the chart.
- Parameters:
- Price (float): The Y value for the line and label.
- Text (string): The text to display alongside the label.
- Color (color): The color for the line and label text.
- Width (int, default=1): The width of the line.
- LineStyle (string, default=line.style_solid): The style of the line.
- Historical (bool, default=false): If true, the line and label will appear on historical chart data.
- Returns: Displays a horizontal line and label on the chart.
- Motive: Enhances readability and usability by providing a function for plotting customizable lines and labels on charts.
Updated:
dll(Price, Text, barCount, Color, Width, LineStyle, Historical)
Parameters:
Price (float)
Text (string)
barCount (int)
Color (color)
Width (int)
LineStyle (string)
Historical (bool)
Added:
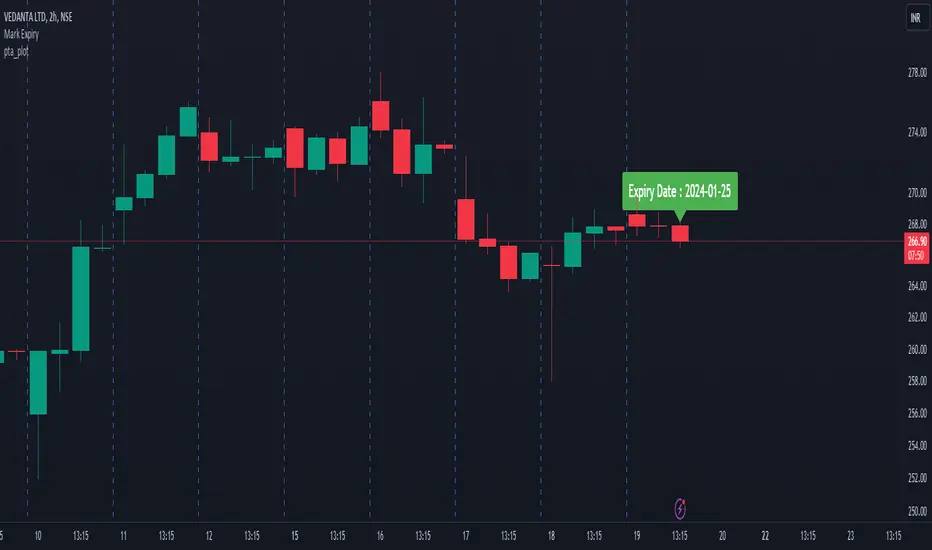
getExpiry(expiryType, expiryDay, changeExpiry, format)
Parameters:
expiryType (string)
expiryDay (string)
changeExpiry (int)
format (string)
Biblioteca Pine
Fiel al espíritu de TradingView, el autor ha publicado este código de Pine como biblioteca de código abierto, para que otros programadores Pine de nuestra comunidad puedan reutilizarlo. ¡Enhorabuena al autor! Puede usar esta biblioteca de forma privada o en otras publicaciones de código abierto, pero la reutilización de este código en publicaciones está sujeta a nuestras Normas internas.
Exención de responsabilidad
Biblioteca Pine
Fiel al espíritu de TradingView, el autor ha publicado este código de Pine como biblioteca de código abierto, para que otros programadores Pine de nuestra comunidad puedan reutilizarlo. ¡Enhorabuena al autor! Puede usar esta biblioteca de forma privada o en otras publicaciones de código abierto, pero la reutilización de este código en publicaciones está sujeta a nuestras Normas internas.