OPEN-SOURCE SCRIPT
NASDAQ Advance/Decline Line 1.0
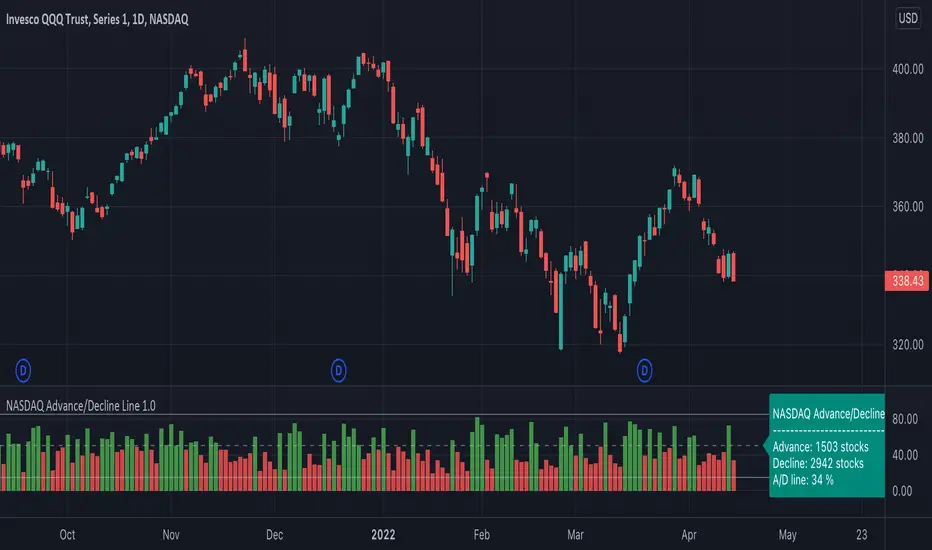
NASDAQ Advance/Decline Line is a Market Breath indicator.
Brought to you by IQ-trading (Andrei Bogdan) via Trading View Pine script. If you find this helpful in anyway, please leave a like!
A/D line calculates a ratio between total number of NASDAQ stocks advancing and total number of NASDAQ stocks in one day, providing another way to grasp the market breath at any moment.A
Green columns mean more than 50% of NASDAQ stocks are advancing, red columns mean more than 50% of NASDAQ stocks are declining.
Green values above the top band mean correlation to the upside, red values bellow the low band mean correlation to the downside.
Correlation means rising probability of capitulation (to the upside or to the downside).
For a better interpretation, NASDAQ Advance/Decline Line should be used in conjunction with other indicators (volatility, volume, etc.).
--------------------
NASDAQ here refers to the totality of assets listed on the NASDAQ exchange, not to the Nasdaq Composite index or the Nasdaq100 index.
NASDAQ is the second-largest stock exchange on earth, and operates the two major stock indexes based on companies that trade on its exchange: the Nasdaq Composite and the Nasdaq 100.
The Nasdaq Composite tracks the performance of more than 3,000 stocks listed on the Nasdaq while the Nasdaq 100 captures the performance of the exchange’s largest non-financial companies.
Script de código abierto
Fiel al espíritu de TradingView, el creador de este script lo ha convertido en código abierto, para que los traders puedan revisar y verificar su funcionalidad. ¡Enhorabuena al autor! Aunque puede utilizarlo de forma gratuita, recuerde que la republicación del código está sujeta a nuestras Normas internas.
Exención de responsabilidad
La información y las publicaciones no constituyen, ni deben considerarse como asesoramiento o recomendaciones financieras, de inversión, de trading o de otro tipo proporcionadas o respaldadas por TradingView. Más información en Condiciones de uso.