OPEN-SOURCE SCRIPT
Actualizado TR High/Low meter
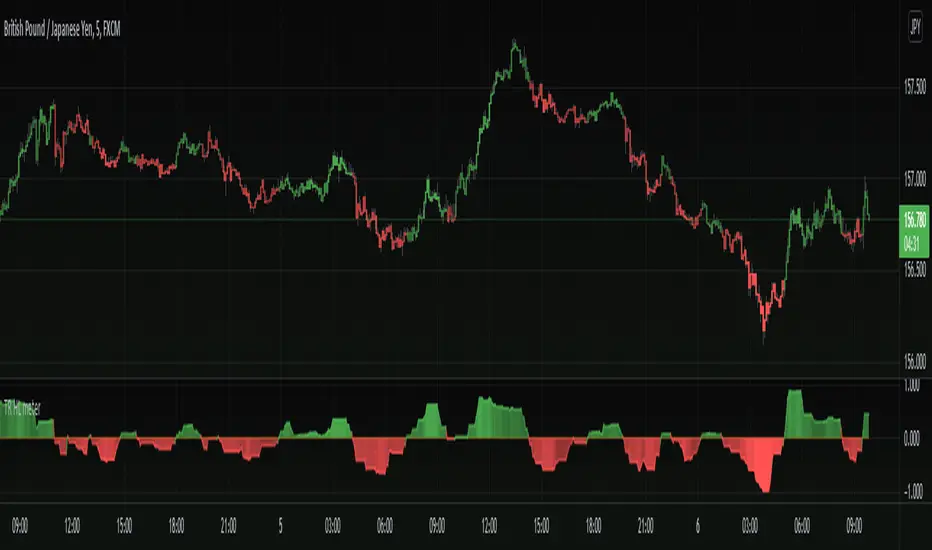
Interesting take for a velocity and trend analysis indicator, I call it The TR high/low meter.
First it will find the highest high and lowest low based on X bars back.
Now comes the twist, instead of storing these lowest or highest prices, we store the TR (true range) into the appropriate array (one array for lowest and one array for highest).
Finally, we sum up these two arrays for highest TR's and lowest TR's and subtract each other to get the difference, Hench, see who is stronger.
In the end we plot the difference into the indicator we have here.
The plot is colored with gradient color in which bright color emphasizes the movement is strong and weaker color emphasizes the movement is getting weaker.
Basically this indicator shows us the asset trend direction and strength. Awesome!
==Colors and Bar Colors==
Green: Up Trending
Light Green: Weakening up trend
Red: Down Trending.
Light Red: Weakening Down Trending.
==Notes==
Bar coloring is enabled on this chart!
Supports EMA smoothing (disabled by default)
Like if you like and Enjoy! Follow for more upcoming indicators/strategies: tradingview.com/u/dman103/
Notas de prensa
Added alerts, Buy, Sell, and Natural (inside trade zone area)Added No trade zone range in which alerts will not trigger.
'No Trade zone' is visualized by white dots and borderlines.
The No-Trade zone is a zone where Buy and Sell alerts will NOT trigger (Note: disabled by default in settings).
Screenshot of 'no-trade zone':
Notas de prensa
Update to version 6 of pinescript.Improved logic to one array instead of two arrays.
Added new plot to external filtering.
Added multi-time frame support.
Minor fixes.
Script de código abierto
Fiel al espíritu de TradingView, el creador de este script lo ha convertido en código abierto, para que los traders puedan revisar y verificar su funcionalidad. ¡Enhorabuena al autor! Aunque puede utilizarlo de forma gratuita, recuerde que la republicación del código está sujeta a nuestras Normas internas.
Appreciation of my work: paypal.me/dman103
All Premium indicators: algo.win
LIVE Stream - Pivot Points Algo: youtube.com/channel/UCFyqab-i0xb2jf-c18ufH0A/live
All Premium indicators: algo.win
LIVE Stream - Pivot Points Algo: youtube.com/channel/UCFyqab-i0xb2jf-c18ufH0A/live
Exención de responsabilidad
La información y las publicaciones no constituyen, ni deben considerarse como asesoramiento o recomendaciones financieras, de inversión, de trading o de otro tipo proporcionadas o respaldadas por TradingView. Más información en Condiciones de uso.