PROTECTED SOURCE SCRIPT
Ekoparaloji Trend Candles
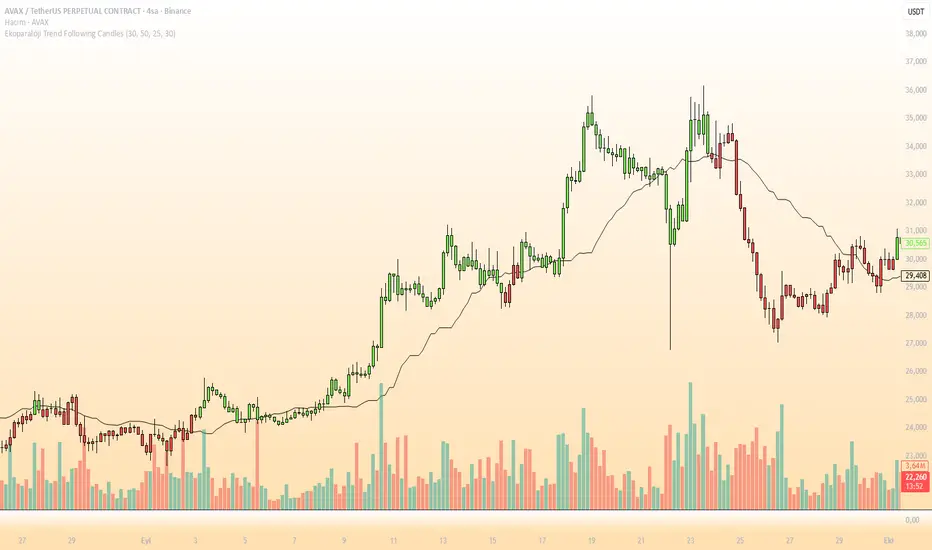
Ekoparaloji Trend Following Candles
🎯 What Does It Do?
This indicator is a candle coloring system that helps you easily identify trend direction. Complex calculations run in the background, and you simply follow the candle colors to understand trend strength.
🎨 How to Use
Read the Candle Colors:
🟢 GREEN CANDLES → Strong uptrend
Look for buying opportunities
Hold your long positions
🔴 RED CANDLES → Strong downtrend
Look for selling opportunities
Consider short positions
Color changes → Potential trend reversal signal
Review your positions
📈 Important: The White Line
The line on the chart is a dynamic support/resistance level:
Price above the line → Bullish zone
Price below the line → Bearish zone
⚙️ Customize Settings
You can adjust 4 parameters in the indicator settings:
Faster signals → Decrease periods (e.g., 20)
Smoother signals → Increase periods (e.g., 50)
Tip: Start with default settings, then optimize for your trading style.
💡 Strategy Tips
✅ Green to red transition → Take profit or exit signal
✅ Red to green transition → Look for entry opportunities
✅ Confirm with other indicators (RSI, MACD, volume, etc.)
✅ Always use stop-loss orders
⚠️ Warning!
No indicator is 100% accurate
Don't trade based solely on this indicator
Risk management should always be your priority
For educational purposes only, not financial advice
Happy trading! 📊
Script protegido
Este script se publica como código cerrado. No obstante, puede utilizarlo libremente y sin ninguna limitación. Obtenga más información aquí.
e-mail: ekoparaloji@gmail.com
X : Ekoparaloji
Yotube: youtube.com/@Ekoparaloji
Instagram : Ekoparaloji
X : Ekoparaloji
Yotube: youtube.com/@Ekoparaloji
Instagram : Ekoparaloji
Exención de responsabilidad
La información y las publicaciones no constituyen, ni deben considerarse como asesoramiento o recomendaciones financieras, de inversión, de trading o de otro tipo proporcionadas o respaldadas por TradingView. Más información en Condiciones de uso.