PROTECTED SOURCE SCRIPT
Stochastic Arrows Crossover with Alerts [TED]
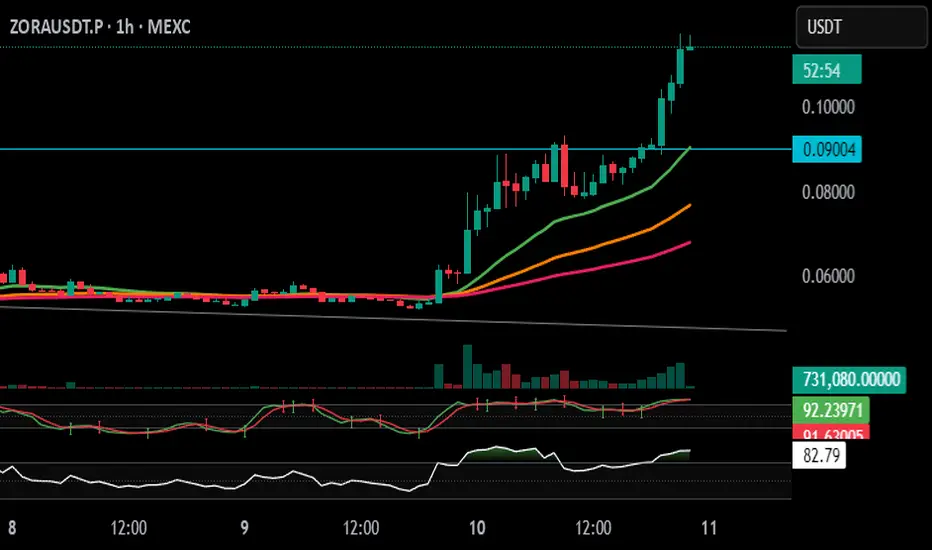
This indicator highlights key Stochastic %K and %D crossovers, helping traders identify potential buy and sell signals with visual triangle arrows and custom alerts. It uses the Stochastic Oscillator, which is a momentum indicator that compares the closing price to the price range over a given period.
Key Features:
Visual Arrows: The indicator plots green triangle-up arrows for bullish crossovers and red triangle-down arrows for bearish crossovers on the chart.
Customizable Parameters: You can adjust the period for %K, %D, and the smoothing factor to fit your trading strategy.
Overbought/Oversold Zones: The background color fills between the 80 (Overbought) and 20 (Oversold) levels, helping you visualize potential reversal areas.
Alerts: Set up dynamic alerts based on the crossover events, including:
Bullish and Bearish Crossovers
Crossover Events from the Previous Bar
How to Use:
Bullish Signal: When the %K line crosses above the %D line, it signals a potential buying opportunity. This is visually represented with a green triangle-up arrow on the chart.
Bearish Signal: When the %K line crosses below the %D line, it signals a potential selling opportunity, indicated by a red triangle-down arrow on the chart.
Overbought/Oversold Zones: The background color fill helps identify overbought or oversold market conditions, which may indicate a potential reversal.
Custom Alerts:
You can set alerts for:
Bullish Crossover: When the %K line crosses above the %D line.
Bearish Crossover: When the %K line crosses below the %D line.
Previous Bar Crossovers: Alerts for crossovers from one bar ago (helpful for backtesting).
Instructions:
Add the Indicator: Apply this Stochastic Arrows Crossover indicator to your chart from the public library.
Customize Settings: Adjust the input parameters like K period, D period, and Smoothing to match your preferred settings.
Enable Alerts:
Once added to your chart, you can set up alerts from the Alert Panel on TradingView.
Choose from the available alert conditions (Bullish Crossover, Bearish Crossover, or Crossover from the Previous Bar).
Set your desired timeframe and alert message to receive notifications for the crossovers.
Monitor the Chart: Keep an eye on the arrows and background color fill to interpret potential trade setups based on the Stochastic Oscillator's behavior.
Script protegido
Este script se publica como código cerrado. No obstante, puede utilizarlo libremente y sin ninguna limitación. Obtenga más información aquí.
Exención de responsabilidad
La información y las publicaciones no constituyen, ni deben considerarse como asesoramiento o recomendaciones financieras, de inversión, de trading o de otro tipo proporcionadas o respaldadas por TradingView. Más información en Condiciones de uso.