OPEN-SOURCE SCRIPT
Actualizado Buying Selling Ratio with Label
Automate your pinescript to Tradovate/Ninja-Trader! ninja-view.com/
The "Buying Selling Ratio with Label" indicator calculates and displays the buying and selling ratio based on volume and price movements. Here's a description of its functionality:
The indicator calculates the buying and selling volumes using the formula:
Buying = Volume * ((Close - Low) / (High - Low))
Selling = Volume * ((High - Close) / (High - Low))
This calculation determines the volume distribution between buying and selling pressure within each bar.
The indicator then calculates the Buying Selling Ratio (BSR) as a percentage using the formula:
BSR = (Buying / (Buying + Selling)) * 100
The BSR value represents the proportion of buying volume relative to the total buying and selling volume.
The BSR is plotted on the chart as a line, with colors indicating different market conditions:
If the BSR is above the overbought level (defined as 90 in this example), the line is displayed in red.
If the BSR is below the oversold level (defined as 10 in this example), the line is displayed in green.
Otherwise, the line is displayed in blue.
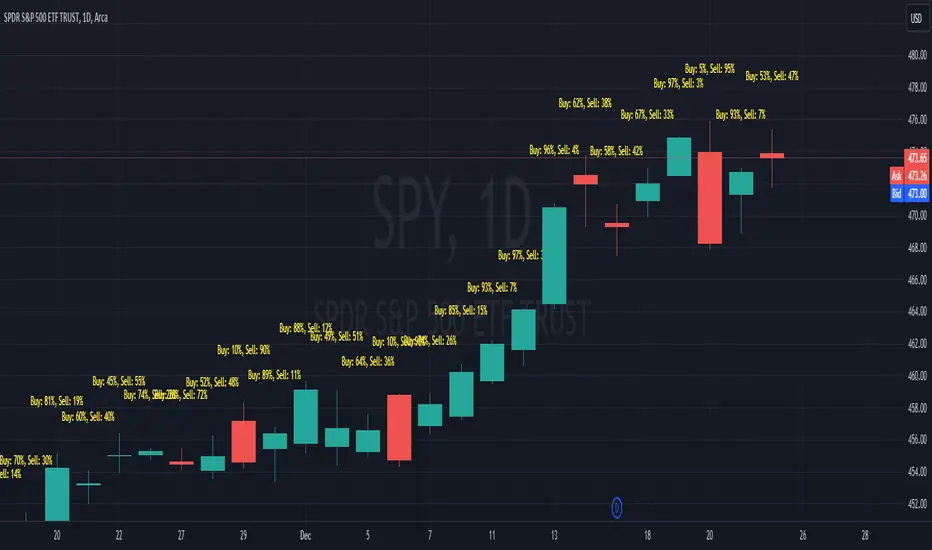
Additionally, the indicator includes labels above each bar to show the buying and selling percentages for that specific bar. The labels display the text "Buy: X%, Sell: Y%", where X represents the percentage of buying volume and Y represents the percentage of selling volume for the given bar.
By enabling the "Show Past Labels" option, the indicator displays labels for previous bars. Otherwise, it only displays the label for the latest bar.
Overall, the indicator provides insights into buying and selling pressures and their relative strengths based on volume analysis.
The "Buying Selling Ratio with Label" indicator calculates and displays the buying and selling ratio based on volume and price movements. Here's a description of its functionality:
The indicator calculates the buying and selling volumes using the formula:
Buying = Volume * ((Close - Low) / (High - Low))
Selling = Volume * ((High - Close) / (High - Low))
This calculation determines the volume distribution between buying and selling pressure within each bar.
The indicator then calculates the Buying Selling Ratio (BSR) as a percentage using the formula:
BSR = (Buying / (Buying + Selling)) * 100
The BSR value represents the proportion of buying volume relative to the total buying and selling volume.
The BSR is plotted on the chart as a line, with colors indicating different market conditions:
If the BSR is above the overbought level (defined as 90 in this example), the line is displayed in red.
If the BSR is below the oversold level (defined as 10 in this example), the line is displayed in green.
Otherwise, the line is displayed in blue.
Additionally, the indicator includes labels above each bar to show the buying and selling percentages for that specific bar. The labels display the text "Buy: X%, Sell: Y%", where X represents the percentage of buying volume and Y represents the percentage of selling volume for the given bar.
By enabling the "Show Past Labels" option, the indicator displays labels for previous bars. Otherwise, it only displays the label for the latest bar.
Overall, the indicator provides insights into buying and selling pressures and their relative strengths based on volume analysis.
Notas de prensa
//updateScript de código abierto
Fiel al espíritu de TradingView, el creador de este script lo ha convertido en código abierto, para que los traders puedan revisar y verificar su funcionalidad. ¡Enhorabuena al autor! Aunque puede utilizarlo de forma gratuita, recuerde que la republicación del código está sujeta a nuestras Normas internas.
Exención de responsabilidad
La información y las publicaciones no constituyen, ni deben considerarse como asesoramiento o recomendaciones financieras, de inversión, de trading o de otro tipo proporcionadas o respaldadas por TradingView. Más información en Condiciones de uso.
Script de código abierto
Fiel al espíritu de TradingView, el creador de este script lo ha convertido en código abierto, para que los traders puedan revisar y verificar su funcionalidad. ¡Enhorabuena al autor! Aunque puede utilizarlo de forma gratuita, recuerde que la republicación del código está sujeta a nuestras Normas internas.
Exención de responsabilidad
La información y las publicaciones no constituyen, ni deben considerarse como asesoramiento o recomendaciones financieras, de inversión, de trading o de otro tipo proporcionadas o respaldadas por TradingView. Más información en Condiciones de uso.