OPEN-SOURCE SCRIPT
real (colored) volume
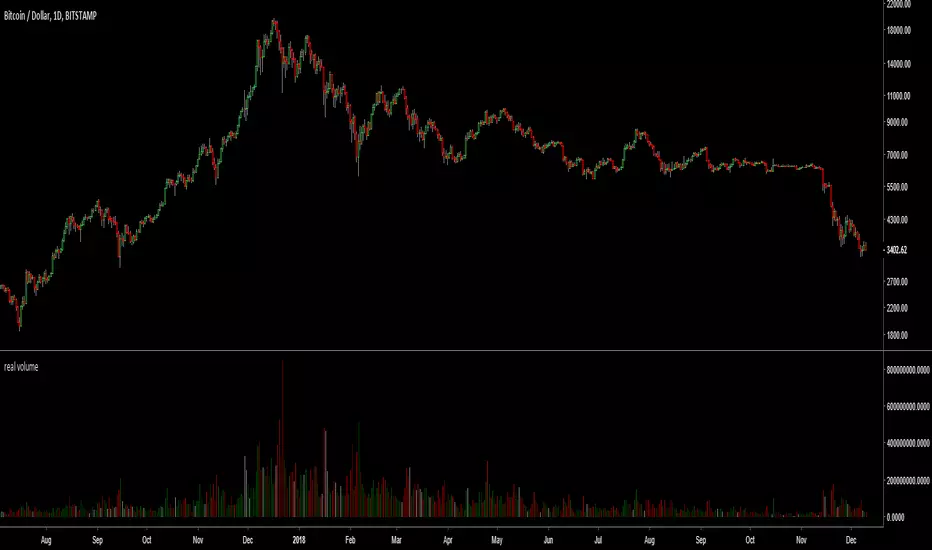
This script plots the volume in terms of the underlying base (e.g. USD or btc) not number of coins traded. It plots volume*mid price.
In addition, the volume color density depends on the candle body divided to high-low. Very green for long up candle body, grey means short candle body compared to high-low, very red for long down candle body. It may provide some indications of the strength of bulls versus bears.
In addition, the volume color density depends on the candle body divided to high-low. Very green for long up candle body, grey means short candle body compared to high-low, very red for long down candle body. It may provide some indications of the strength of bulls versus bears.
Script de código abierto
Fiel al espíritu de TradingView, el creador de este script lo ha convertido en código abierto, para que los traders puedan revisar y verificar su funcionalidad. ¡Enhorabuena al autor! Aunque puede utilizarlo de forma gratuita, recuerde que la republicación del código está sujeta a nuestras Normas internas.
Exención de responsabilidad
La información y las publicaciones no constituyen, ni deben considerarse como asesoramiento o recomendaciones financieras, de inversión, de trading o de otro tipo proporcionadas o respaldadas por TradingView. Más información en Condiciones de uso.