OPEN-SOURCE SCRIPT
Actualizado Multiple SMAs
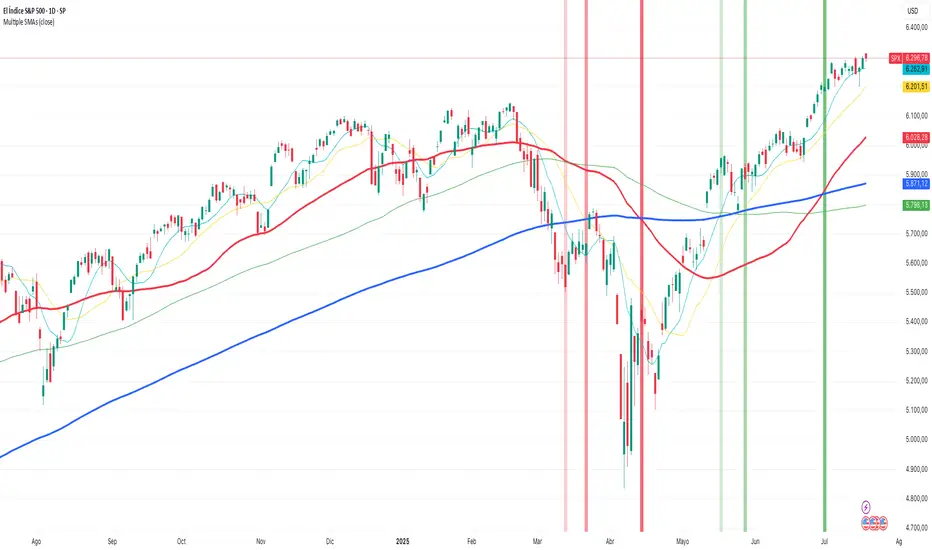
Plots multiple SMAs in a single indicator.
This script only plots the SMAs if the timeframe is set to daily.
- SMA10 in light blue
- SMA20 in yellow
- SMA50 in red
- SMA100 in green
- SMA200 in blue
It also plots the crosses between SMA20 and SMA50
This script only plots the SMAs if the timeframe is set to daily.
- SMA10 in light blue
- SMA20 in yellow
- SMA50 in red
- SMA100 in green
- SMA200 in blue
It also plots the crosses between SMA20 and SMA50
Notas de prensa
Plots multiple SMAs in a single indicator.This script only plots the SMAs if the timeframe is set to daily, weekly or monthly.
- SMA10 in light blue (daily or weekly)
- SMA20 in yellow (daily or weekly)
- SMA50 in red (daily or weekly)
- SMA100 in green
- SMA200 in blue
It also plots entry and exit alerts,
- Crosses between SMA10 and SMA200 (very light green/red vertical bar)
- Crosses between SMA20 and SMA200 (light green/red vertical bar)
- Crosses between SMA50 and SMA200 (green/red vertical bar)
Script de código abierto
Fiel al espíritu de TradingView, el creador de este script lo ha convertido en código abierto, para que los traders puedan revisar y verificar su funcionalidad. ¡Enhorabuena al autor! Aunque puede utilizarlo de forma gratuita, recuerde que la republicación del código está sujeta a nuestras Normas internas.
Exención de responsabilidad
La información y las publicaciones no constituyen, ni deben considerarse como asesoramiento o recomendaciones financieras, de inversión, de trading o de otro tipo proporcionadas o respaldadas por TradingView. Más información en Condiciones de uso.