OPEN-SOURCE SCRIPT
Z-Score Regression Bands [BOSWaves]
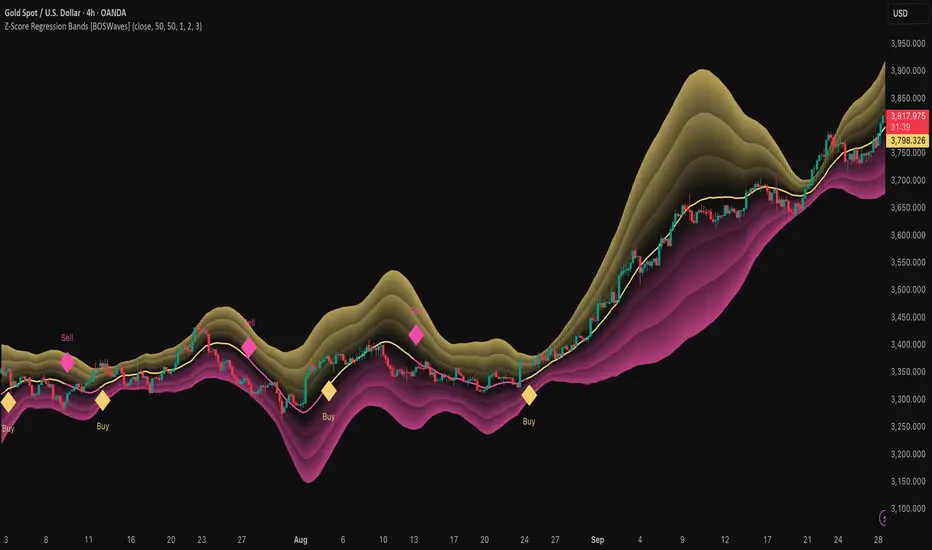
Z-Score Regression Bands [BOSWaves] – Adaptive Trend and Volatility Insight
Overview
The Z-Score Regression Bands is a trend and volatility analysis framework designed to give traders a clear, structured view of price behavior. It combines Least Squares Moving Average (LSMA) regression, a statistical method to detect underlying trends, with Z-Score standardization, which measures how far price deviates from its recent average.

Traditional moving average bands, like Bollinger Bands, often lag behind trends or generate false signals in noisy markets. Z-Score Regression Bands addresses these limitations by:
This multi-layered approach allows traders to understand trend strength, detect overextensions, and identify periods of low or high volatility — all from a single, clear chart overlay. It is designed for traders of all levels and can be applied across scalping, day trading, swing trading, and longer-term strategies.
Theoretical Foundation
The Z-Score Regression Bands are grounded in statistical and trend analysis principles. Here’s the idea in plain terms:
How It Works
The indicator calculates and plots several layers of information:
LSMA Regression (Trend Detection)
Z-Score Calculation (Deviation Measurement)
Multi-Band Construction (Volatility Envelope)
Trend Signals (Diamonds)
Visual Interpretation
Interpretation
The Z-Score Regression Bands provide a multi-dimensional view of market behavior:
By combining these insights, traders can avoid false signals and react to meaningful structural shifts in the market.
Strategy Integration
Trend Following
Breakout Trading
Mean Reversion/Pullback
Exhaustion & Reversals
Multi-Timeframe Confirmation
Technical Implementation
Optimal Application
Asset Classes:
Timeframes:
Performance Characteristics
Strong Performance:
Weak Performance:
Integration Tips
Disclaimer
The Z-Score Regression Bands is a trading analysis tool, not a guaranteed profit system. Its effectiveness depends on market conditions, parameter selection, and disciplined risk management. Use it as part of a broader trading strategy, not in isolation.
Overview
The Z-Score Regression Bands is a trend and volatility analysis framework designed to give traders a clear, structured view of price behavior. It combines Least Squares Moving Average (LSMA) regression, a statistical method to detect underlying trends, with Z-Score standardization, which measures how far price deviates from its recent average.
Traditional moving average bands, like Bollinger Bands, often lag behind trends or generate false signals in noisy markets. Z-Score Regression Bands addresses these limitations by:
- Tracking trends accurately using LSMA regression
- Normalizing deviations with Z-Scores to identify statistically significant price extremes
- Visualizing multiple bands for normal, strong, and extreme moves
- Highlighting trend shifts using diamond markers based on Z-Score crossings
This multi-layered approach allows traders to understand trend strength, detect overextensions, and identify periods of low or high volatility — all from a single, clear chart overlay. It is designed for traders of all levels and can be applied across scalping, day trading, swing trading, and longer-term strategies.
Theoretical Foundation
The Z-Score Regression Bands are grounded in statistical and trend analysis principles. Here’s the idea in plain terms:
- Least Squares Moving Average (LSMA) – Unlike standard moving averages, LSMA fits a straight line to recent price data using regression. This “best-fit” line shows the underlying trend more precisely and reduces lag, helping traders see trend changes earlier.
- Z-Score Standardization – A Z-Score expresses how far the LSMA is from its recent mean in standard deviation units. This shows whether price is unusually high or low, which can indicate potential reversals, pullbacks, or acceleration of a trend.
- Multi-Band Structure – The three bands represent: Band #1: Normal range of price fluctuations; Band #2: Significant deviation from the trend; Band #3: Extreme price levels that are statistically rare. The distance between bands dynamically adapts to market volatility, allowing traders to visualize expansions (higher volatility) and contractions (lower volatility).
- Trend Signals – When Z-Score crosses zero, diamonds appear on the chart. These markers signal potential trend initiation, continuation, or reversal, offering a simple alert for shifts in market momentum.
How It Works
The indicator calculates and plots several layers of information:
LSMA Regression (Trend Detection)
- Computes a line that best fits recent price points.
- The LSMA line smooths out minor fluctuations while reflecting the general direction of the market.
Z-Score Calculation (Deviation Measurement)
- Standardizes the LSMA relative to its recent average.
- Positive Z-Score → LSMA above average, negative → LSMA below average.
- Helps identify overbought or oversold conditions relative to the trend.
Multi-Band Construction (Volatility Envelope)
- Upper and lower bands are placed at configurable multiples of standard deviation.
- Band #1 captures typical price movement, Band #2 signals stronger deviation, Band #3 highlights extreme moves.
- Bands expand and contract with volatility, giving an intuitive visual guide to market conditions.
Trend Signals (Diamonds)
- Appear when Z-Score crosses zero.
- Indicates moments when momentum may shift, helping traders time entries or exits.
Visual Interpretation
- Band width = volatility: wide bands indicate strong movement; narrow bands indicate calm periods.
- LSMA shows underlying trend direction, while bands show how far price has strayed from that trend.
Interpretation
The Z-Score Regression Bands provide a multi-dimensional view of market behavior:
- Trend Analysis – LSMA line slope shows general market direction.
- Momentum & Volatility – Z-Score indicates whether the trend is accelerating or losing strength; band width indicates volatility levels.
- Price Extremes – Price touching Band #2 or #3 may suggest overextension and potential reversals.
- Trend Shifts – Diamonds signal statistically significant changes in momentum.
- Cycle Awareness – Standard deviation bands help distinguish normal market fluctuations from extreme events.
By combining these insights, traders can avoid false signals and react to meaningful structural shifts in the market.
Strategy Integration
Trend Following
- Enter trades when diamonds indicate momentum aligns with LSMA direction.
- Use Band #1 and #2 for stop placement and partial exits.
Breakout Trading
- Watch for narrow bands (low volatility) followed by price pushing outside Band #1 or #2.
- Confirm with Z-Score movement in the breakout direction.
Mean Reversion/Pullback
- If price reaches Band #2 or #3 without continuation, expect a pullback toward LSMA.
Exhaustion & Reversals
- Flattening Z-Score near zero while price remains at extreme bands signals trend weakening.
- Tighten stops or scale out before a potential reversal.
Multi-Timeframe Confirmation
- High timeframe LSMA confirms the main trend.
- Lower timeframe bands provide refined entry and exit points.
Technical Implementation
- LSMA Regression: Best-fit line minimizes lag and captures trend slope.
- Z-Score Standardization: Normalizes deviation to allow consistent interpretation across markets.
- Multi-Band Envelope: Three layers for normal, strong, and extreme deviations.
- Trend Signals: Automatic diamonds for Z-Score zero-crossings.
- Band Fill Options: Optional shading to visualize volatility expansions and contractions.
Optimal Application
Asset Classes:
- Forex: Capture breakouts, overextensions, and trend shifts.
- Crypto: High-volatility adaptation with adjustable band multipliers.
- Stocks/ETFs: Identify trending sectors, reversals, and pullbacks.
- Indices/Futures: Track cycles and structural trends.
Timeframes:
- Scalping (1–5 min): Focus on Band #1 and trend signals for fast entries.
- Intraday (15m–1h): Use Bands #1–2 for continuation and breakout trades.
- Swing (4h–Daily): Bands #2–3 capture trend momentum and exhaustion.
- Position (Daily–Weekly): LSMA trend dominates; Bands #3 highlight regime extremes.
Performance Characteristics
Strong Performance:
- Trending markets with moderate-to-high volatility
- Assets with steady liquidity and identifiable cycles
Weak Performance:
- Flat or highly choppy markets
- Very short timeframes (<1 min) dominated by noise
Integration Tips
- Combine with support/resistance, volume, or order flow analysis for confirmation.
- Use bands for stops, targets, or scaling positions.
- Apply multi-timeframe analysis: higher timeframe LSMA confirms main trend, lower timeframe bands refine entries.
Disclaimer
The Z-Score Regression Bands is a trading analysis tool, not a guaranteed profit system. Its effectiveness depends on market conditions, parameter selection, and disciplined risk management. Use it as part of a broader trading strategy, not in isolation.
Script de código abierto
Fiel al espíritu de TradingView, el creador de este script lo ha convertido en código abierto, para que los traders puedan revisar y verificar su funcionalidad. ¡Enhorabuena al autor! Aunque puede utilizarlo de forma gratuita, recuerde que la republicación del código está sujeta a nuestras Normas internas.
Exención de responsabilidad
La información y las publicaciones no pretenden ser, ni constituyen, asesoramiento o recomendaciones financieras, de inversión, de trading o de otro tipo proporcionadas o respaldadas por TradingView. Más información en Condiciones de uso.