OPEN-SOURCE SCRIPT
Top-Down Analysis - Multi-Timeframe Alignment
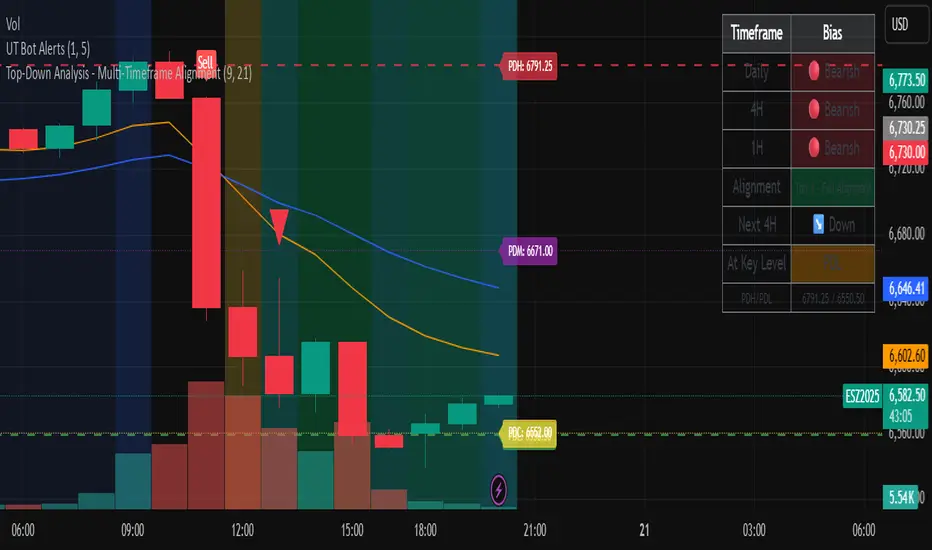
This indicator implements a Top-Down Multi-Timeframe Trading Analysis System. Here's what it does:
Core Functionality
1. Multi-Timeframe Bias Detection
Monitors three timeframes: Daily, 4-Hour, and 1-Hour
Determines if each timeframe is bullish, bearish, or neutral based on two EMAs (9 and 21 period by default)
A timeframe is bullish when: Fast EMA > Slow EMA AND price is above Fast EMA
A timeframe is bearish when: Fast EMA < Slow EMA AND price is below Fast EMA
2. Alignment Tier System
Tier 1 (Full Alignment): All three timeframes agree (Daily = 4H = 1H direction)
Tier 2 (Partial Alignment): Daily and 1H agree, but 4H differs
No Alignment: Timeframes disagree
3. Previous Day Support & Resistance Levels
Automatically plots key levels from the previous day:
Previous Day High (PDH) - resistance
Previous Day Low (PDL) - support
Previous Day Close (PDC)
Previous Day Midpoint (PDM)
4. Execution Zone (15-Minute Window)
Highlights the first 15 minutes after each new 4H candle opens
This is the optimal entry window when alignment conditions are met
5. Pattern Recognition
Detects trading setups:
Double tops/bottoms
Long wicks at support/resistance
Bullish/bearish closes aligned with bias
6. Trade Signals
Generates entry signals when:
There's Tier 1 or Tier 2 alignment
Price is in the 15-minute execution zone
A valid pattern forms (double top/bottom or wick rejection)
7. Visual Dashboard
Shows a real-time table with:
Each timeframe's current bias
Alignment status
Next 4H prediction
Whether price is at a key support/resistance level
Trading Strategy
The indicator helps traders follow the principle of "trade with the higher timeframe trend" by only taking trades when multiple timeframes agree, focusing entries during specific windows, and respecting previous day's key price levels as potential reaction zones.
Script de código abierto
Fiel al espíritu de TradingView, el creador de este script lo ha convertido en código abierto, para que los traders puedan revisar y verificar su funcionalidad. ¡Enhorabuena al autor! Aunque puede utilizarlo de forma gratuita, recuerde que la republicación del código está sujeta a nuestras Normas internas.
Exención de responsabilidad
La información y las publicaciones no constituyen, ni deben considerarse como asesoramiento o recomendaciones financieras, de inversión, de trading o de otro tipo proporcionadas o respaldadas por TradingView. Más información en Condiciones de uso.