PROTECTED SOURCE SCRIPT
Ultimate Gann Fan Suite with Multi-Arcs
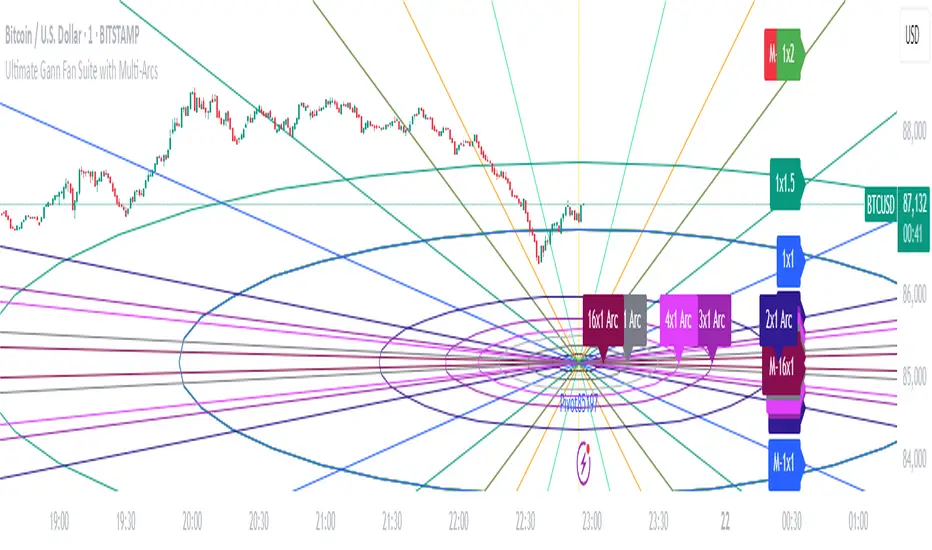
Ultimate Gann Fan Suite with Multi-Arcs
This open-source indicator plots Gann Fan angles, arcs, and levels to analyze price and time relationships based on a user-selected pivot point.
What It Does:
- Draws Gann Fan angles (1x16 to 16x1) from a pivot, with optional mirrored lines.
- Plots a base Gann arc and multi-arcs scaled by Gann ratios.
- Displays a Square of 9 grid and Gann Square levels for price projections.
- Supports custom timeframes and price types for pivot selection.
How to Use:
- Pivot: Enable manual pivot picking and select a price type (e.g., Close, High).
- Timeframe: Choose a timeframe (e.g., Daily) for pivot data.
- Angles and Arcs: Show/hide specific Gann angles, arcs, or levels; adjust colors and line styles.
- Scaling: Set price scale (e.g., 9.0) and arc radius (e.g., 36) for visual clarity.
- Labels: Enable labels to identify angles and levels.
- Best for stocks, forex, or crypto on daily or weekly charts.
Notes:
- Ensure enough chart history for the selected timeframe.
- Use on assets with clear trends or cycles for best results.
- Adjust settings to balance chart readability.
Script protegido
Este script se publica como código cerrado. No obstante, puede utilizarlo libremente y sin ninguna limitación. Obtenga más información aquí.
Exención de responsabilidad
La información y las publicaciones no constituyen, ni deben considerarse como asesoramiento o recomendaciones financieras, de inversión, de trading o de otro tipo proporcionadas o respaldadas por TradingView. Más información en Condiciones de uso.