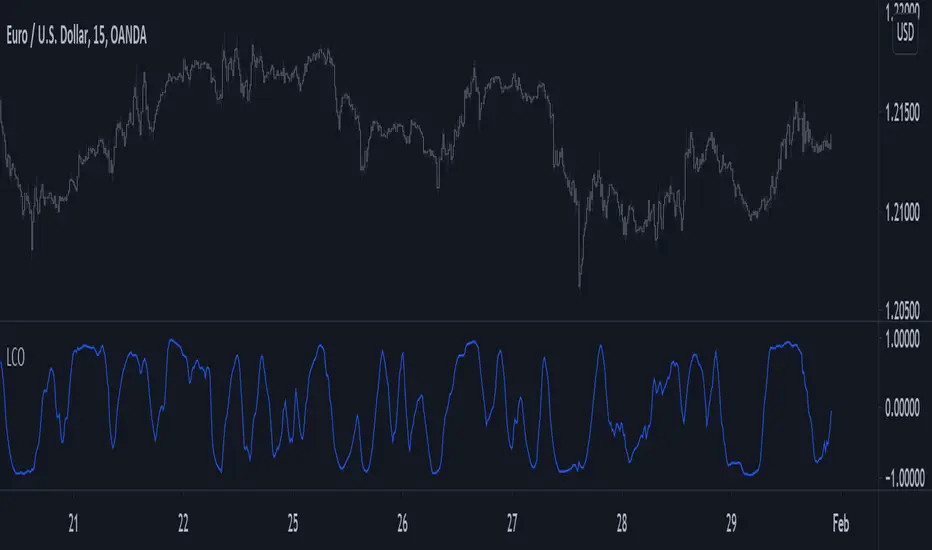
You don't need loops to get the rolling correlation between an input series and a linear sequence of values, this can be obtained from the normalized difference between a WMA and an SMA of the input series.
The closed-form solutions for the moving average and standard deviation of a linear sequence can be easily calculated, while the same rolling statistics for the input series can be computed using cumulative sums. All these concepts were introduced in previous indicators posts long ago.
This approach can allow to efficiently compute the rolling R-Squared of a linear regression, as well as its SSE.
Using the rolling correlation as a trend indicator is often attributed to John Ehlers with the correlation trend indicator (Correlation As A Trend Indicator), but the applications of this precise method can be traced back quite a while ago by a wide variety of users, in fact, the LSMA can be computed using this precise indicator. You can see an example where the correlation oscillator appears below:

Script de código abierto
Fiel al espíritu de TradingView, el creador de este script lo ha convertido en código abierto, para que los traders puedan revisar y verificar su funcionalidad. ¡Enhorabuena al autor! Aunque puede utilizarlo de forma gratuita, recuerde que la republicación del código está sujeta a nuestras Normas internas.
Check out the indicators we are making at luxalgo: tradingview.com/u/LuxAlgo/
"My heart is so loud that I can't hear the fireworks"
"My heart is so loud that I can't hear the fireworks"
Exención de responsabilidad
La información y las publicaciones no constituyen, ni deben considerarse como asesoramiento o recomendaciones financieras, de inversión, de trading o de otro tipo proporcionadas o respaldadas por TradingView. Más información en Condiciones de uso.
