OPEN-SOURCE SCRIPT
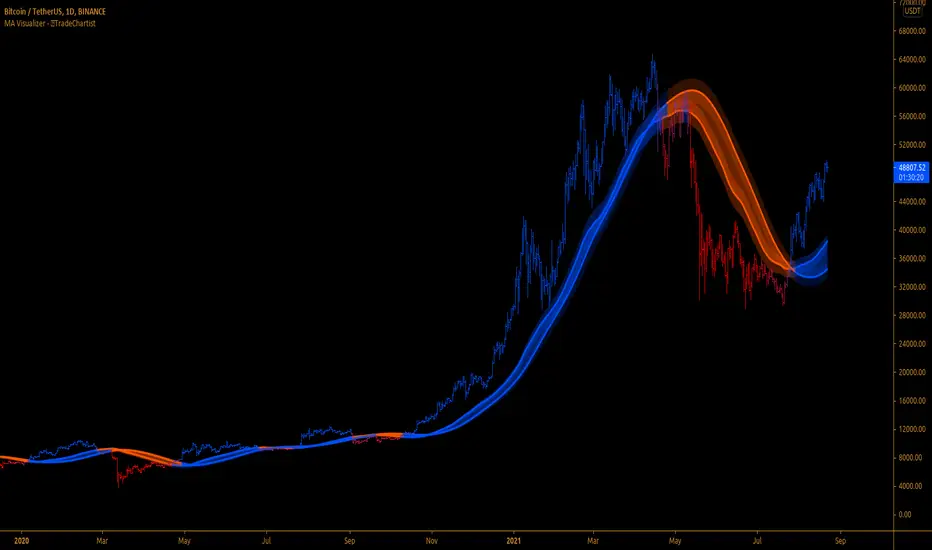
MA Visualizer

™TradeChartist MA Visualizer is a Moving Average based indicator aimed to visualize price action in relation to the Moving Average in a visually engaging way.
===================================================================================================================
█ MA Visualizer Features
█ Example Charts
1. 1hr chart of XAUUSD using 55 period WMA.

2. 15m chart of
 EURUSD using 144 period Tillson T3 MA.

3. 4 hr chart of US30USD using 55 period SMMA.

===================================================================================================================
Best Practice: Test with different settings first using Paper Trades before trading with real money
===================================================================================================================
===================================================================================================================
█ MA Visualizer Features
- 11 different Moving Averages to choose from the settings to visualize based on MA Visualizer Length (Default - 55 period SMA).
- 2 Smoothing options (default - 0, 0 uses MA length as Smoothing factor, 1 uses no Smoothing).
- 4 colour themes to choose from and option to adjust Visualizer Vibrance.
█ Example Charts
1. 1hr chart of
2. 15m chart of
3. 4 hr chart of
===================================================================================================================
Best Practice: Test with different settings first using Paper Trades before trading with real money
===================================================================================================================
Script de código abierto
Fiel al espíritu de TradingView, el creador de este script lo ha convertido en código abierto, para que los traders puedan revisar y verificar su funcionalidad. ¡Enhorabuena al autor! Aunque puede utilizarlo de forma gratuita, recuerde que la republicación del código está sujeta a nuestras Normas internas.
Get in touch with me if you would like access to my Premium scripts for a trial before deciding on lifetime access.
Telegram - @Trade_Chartist
Free Scripts - bit.ly/Free-Scripts
Telegram - @Trade_Chartist
Free Scripts - bit.ly/Free-Scripts
Exención de responsabilidad
La información y las publicaciones no constituyen, ni deben considerarse como asesoramiento o recomendaciones financieras, de inversión, de trading o de otro tipo proporcionadas o respaldadas por TradingView. Más información en Condiciones de uso.