OPEN-SOURCE SCRIPT
CBG Key Numbers v6

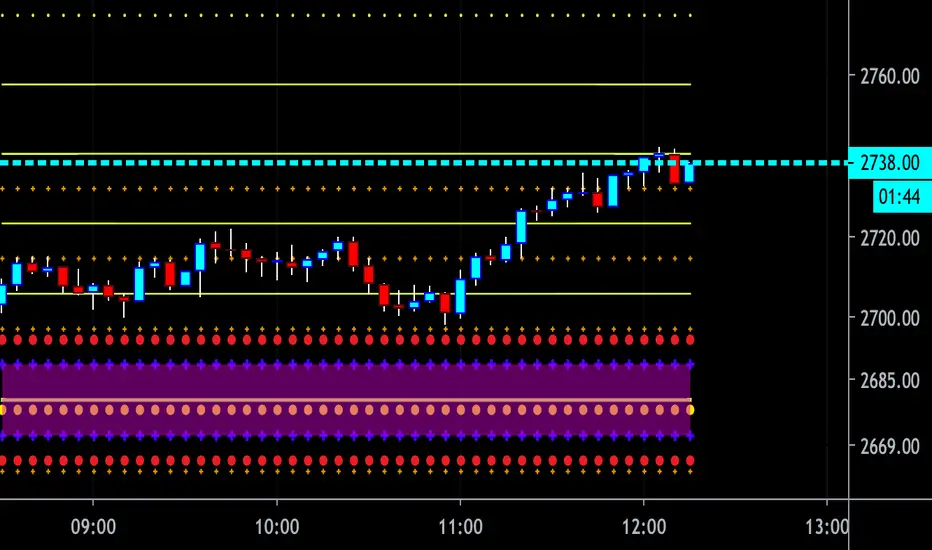
Here is my opening range, key numbers indicator. It takes the Opening Range (5 minutes by default) and then plots the opening range and up to 7 extensions of that range above and below.
It's amazing how the OR is stamped up on the rest of the day's price movements.
2 strategies (at least) are to play the OR range breakout and to fade when price hits an extreme range.
You have total control over how you set up the various lines and colors.
If you start overlaying the trading day with the OR and it's extensions, you will see amazing patterns become clear. For example, the pump and reverse. This is where price pumps right out of the opening and then reverses later in the morning.
I have the opening price set to big circles as this is one of the most important reference points during the day.
Important: For some reason, the 9:30 am time Opening acts differently for equities and futures . For equities, you can set the time values to 0930. But for futures , to capture the Open at 9:30, you have to set the time values to start at 0830. I haven't been able to find a better solution but setting the times manually works. Make sure to set all the time values on the Options screen.
There is one more setting of interest. It is called IB Target Amount. This is a number above and below the opening range that I have observed price to hit whenever there's a breakout. This will allow you to predict a price target on breakouts. For SPY , I have found that price usually breaks out to at least 50 cents. On ES futures , it's 6 dollars. This can help you lock in 10% and 20% when trading options and is a great tool. That's why I have it so prominent in red. You will also see price return to this level during the day and act as support or resistance.
Please disregard the red and green shaded rectangles. They are my own support and resistance zones and TV wouldn't let me hide them from the picture. :-)
I mostly use this on a 5 minute chart but any timeframe will work.
Script de código abierto
Fiel al espíritu de TradingView, el creador de este script lo ha convertido en código abierto, para que los traders puedan revisar y verificar su funcionalidad. ¡Enhorabuena al autor! Aunque puede utilizarlo de forma gratuita, recuerde que la republicación del código está sujeta a nuestras Normas internas.
Exención de responsabilidad
La información y las publicaciones no constituyen, ni deben considerarse como asesoramiento o recomendaciones financieras, de inversión, de trading o de otro tipo proporcionadas o respaldadas por TradingView. Más información en Condiciones de uso.