OPEN-SOURCE SCRIPT
Z SMMA | QuantEdgeB
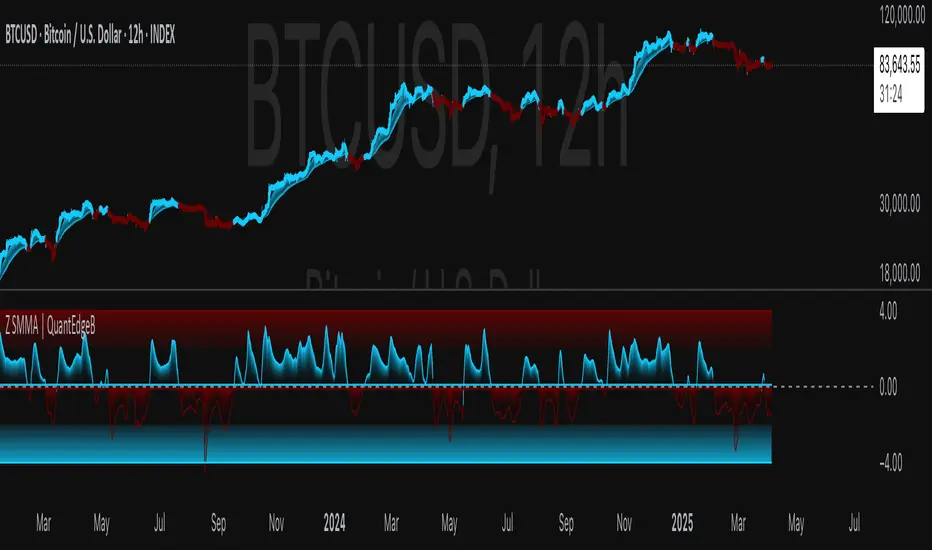
📈 Introducing Z-Score SMMA (Z SMMA) by QuantEdgeB
🛠️ Overview
Z SMMA is a momentum-driven oscillator designed to track the standardized deviation of a Smoothed Moving Average (SMMA). By applying Z-score normalization, this tool dynamically adapts to price volatility, enabling traders to detect meaningful directional shifts and trend changes with enhanced clarity.
It serves both as a trend-following and mean-reversion system, identifying opportunities through standardized thresholds while remaining robust across volatile and calm market conditions.
✨ Key Features
🔹 Z-Score Normalization Engine
Applies Z-score to a custom SMMA baseline, allowing traders to compare price action relative to its recent volatility-adjusted mean.
🔹 Dynamic Trend Detection
Generates actionable long/short signals based on customizable Z-thresholds, making it adaptable across different asset classes and timeframes.
🔹 Overbought/Oversold Zones
Highlight reversion and profit-taking zones (default OB: +2 to +4, OS: -2 to -4), great for counter-trend or mean-reversion strategies.
🔹 Visual Reinforcement Tools
Includes candle coloring, gradient fills, and optional ALMA/EMA band overlays to visualize trend regime transitions.
🔍 How It Works
1️⃣ Z-Score SMMA Calculation
The core is a custom Smoothed Moving Average (SMMA) that is normalized by its standard deviation over a lookback period.
Final Formula:
Z = (SMMA - Mean) / StdDev
2️⃣ Signal Generation
• ✅ Long Bias: Z-Score > Long Threshold (default: 0)
• ❌ Short Bias: Z-Score < Short Threshold (default: 0)
3️⃣ Visual Aids
• Candle Color → Shows trend bias
• Band Fills → Highlight trend strength
• Overlays → Optional ALMA/EMA bands for structure analysis
⚙️ Custom Settings
• SMMA Length → Default: 12
• Z-Score Lookback → Default: 30
• Long Threshold → Default: 0
• Short Threshold → Default: 0
• Color Themes → Choose from 6 visual modes
• Extra Plots → Toggle advanced overlays (ALMA, EMA, bands)
• Label Display → Show/hide “𝓛𝓸𝓷𝓰” & “𝓢𝓱𝓸𝓻𝓽” markers
👥 Who Should Use It?
✅ Trend Traders → For early entries with confirmation from Z-score expansion
✅ Quantitative Analysts → Standardized deviation enables comparison across assets
✅ Mean-Reversion Traders → Use OB/OS zones to fade parabolic spikes
✅ Swing & Systematic Traders → Identify momentum shifts with optional ALMA/EMA overlays
📌 Conclusion
Z SMMA offers a smart, adaptive framework for tracking deviation from equilibrium in a quant-friendly format. Whether you're looking to follow trends or catch exhaustion points, Z SMMA provides a clear, standardized view of momentum and price extremes.
🔹 Key Takeaways:
1️⃣ Z-Score standardization ensures dynamic range awareness
2️⃣ SMMA base filters out noise, offering smoother signals
3️⃣ Color-coded visuals support faster reaction and cleaner charts
📌 Disclaimer: Past performance is not indicative of future results. No trading strategy can guarantee success in financial markets.
📌 Strategic Advice: Always backtest, optimize, and align parameters with your trading objectives and risk tolerance before
Script de código abierto
Fiel al espíritu de TradingView, el creador de este script lo ha convertido en código abierto, para que los traders puedan revisar y verificar su funcionalidad. ¡Enhorabuena al autor! Aunque puede utilizarlo de forma gratuita, recuerde que la republicación del código está sujeta a nuestras Normas internas.
🔹 Get access to our premium tools:
whop.com/quantedgeb/ 💎
🔹 Unlock our free toolbox:
tradinglibrary.carrd.co/ 🛠️
Disclaimer: All resources and indicators provided are for educational purposes only
whop.com/quantedgeb/ 💎
🔹 Unlock our free toolbox:
tradinglibrary.carrd.co/ 🛠️
Disclaimer: All resources and indicators provided are for educational purposes only
Exención de responsabilidad
La información y las publicaciones no constituyen, ni deben considerarse como asesoramiento o recomendaciones financieras, de inversión, de trading o de otro tipo proporcionadas o respaldadas por TradingView. Más información en Condiciones de uso.